
Videos
Safegate Foods, Inc., is redesigning the checkout lanes in its supermarkets throughout the country and is considering two designs. Tests on customer checkout times conducted at two stores where the two new systems have been installed result in the following summary of the data.
| System A | System B |
| n1 = 120 | n2 = 100 |
|
|
|
| σ1 = 2.2 minutes | σ2 = 1.5 minutes |
Test at the .05 level of significance to determine whether the population mean checkout times of the two systems differ. Which system is preferred?
Test whether the population mean checkout times of the two systems differ at .05 level of significance or not.
Suggest the preferable system.
Answer to Problem 38SE
There is sufficient evidence to conclude that, there is a difference between the population mean checkout times of the two systems.
The preferable system is system A.
Explanation of Solution
Calculation:
The results of the tests on customer checkout times at system A and system B are as follows:
| System A | System B |
The level of significance is
State the hypothesis:
The test hypotheses are as follows:
Null hypothesis:
That is, there is no difference between the population mean checkout times of the two systems.
Alternative hypothesis:
That is, there is difference between the population mean checkout times of the two systems.
Test statistic:
The test statistic for hypothesis tests about
Substitute
Thus, the test statistic is 2.79.
Software procedure:
Step-by-step software procedure to obtain the mean using MINITAB software is as follows,
- Choose Graph > Probability Distribution Plot choose View Probability > OK.
- From Distribution, choose ‘Normal’ distribution.
- Click the Shaded Area tab.
- Choose X Value and Two Tail for the region of the curve to shade.
- Enter the data value as 2.79.
- Click OK.
Output using MINITAB software is as follows:
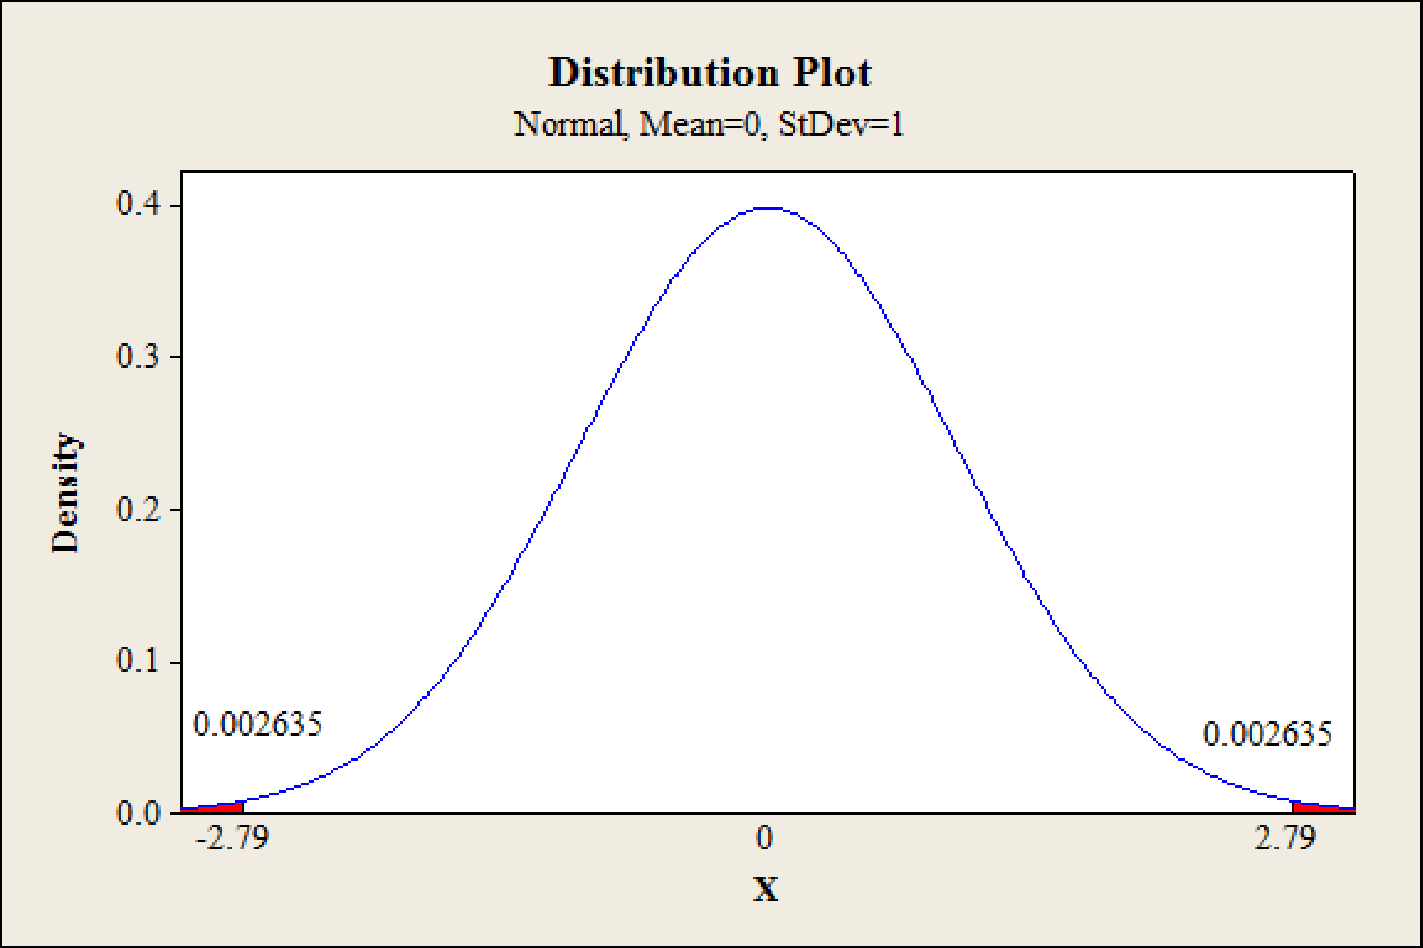
Thus, the p-value is 0.0052
Decision rule based on p-value approach:
If p-value ≤ α, then reject the null hypothesis H0.
If p-value > α, then fail to reject the null hypothesis H0.
Conclusion:
Here, the p-value 0.0052 is less than or equal to the significance level 0.05.
That is,
Thus, the null hypothesis is rejected.
Therefore, there is sufficient evidence to conclude that, there is a difference between the population mean checkout times of the two systems.
Thus, there is a difference between the population mean checkout times of the two systems.
Here the mean checkout time of system B is less when compared to the mean checkout time of system A.
Therefore, system A is preferable.
Want to see more full solutions like this?
Chapter 10 Solutions
Statistics for Business & Economics


- A paper investigated the driving behavior of teenagers by observing their vehicles as they left a high school parking lot and then again at a site approximately 1 2 mile from the school. Assume that it is reasonable to regard the teen drivers in this study as representative of the population of teen drivers. MaleDriver FemaleDriver 1.3 -0.3 1.3 0.6 0.9 1.1 2.1 0.7 0.7 1.1 1.3 1.2 3 0.1 1.3 0.9 0.6 0.5 2.1 0.5 (a) Use a .01 level of significance for any hypothesis tests. Data consistent with summary quantities appearing in the paper are given in the table. The measurements represent the difference between the observed vehicle speed and the posted speed limit (in miles per hour) for a sample of male teenage drivers and a sample of female teenage drivers. (Use ?males − ?females. Round your test statistic to two decimal places. Round your degrees of freedom down to the nearest whole number. Round your p-value to three decimal places.) t = df =…arrow_forwardQuestion 2 A researcher was interested in studying if there is a significant relationship between the severity of COVID 19 and blood types of individuals. 2400 individuals were studied and the results are shown below. Condition Blood Type O A B AB Total Critical 64 44 20 8 136 Severe 175 129 50 15 369 Moderate 211 528 151 125 1015 Mild 200 400 140 140 880 Total 650 1101 361 288 240 a .State both the null and alternative hypotheses. b. Provide the decision rule for making this decision. Use an alpha level of 5%. c. Show all of the work necessary to calculate the appropriate statistic.d. What conclusion are you allowed to draw? e. Would your conclusion change at the 10% level of significance?arrow_forwardA study regarding the average cost of online streaming services in two states (A and B) is conducted. The results are shown in the following table. X and Y are independent.arrow_forward
- The males of stalk-eyed flies (Cyrtodiopsis dalmanni) have long eye stalks. The females sometimes use the length of these eye stalks to choose mates. Is the male’s eye-stalk length affected by the quality of its diet? An experiment was carried out in which two groups of male “stalkies” were reared on different foods (David et al. 2000). One group was fed “corn” (considered a high quality food), while the other was fed “cotton” wool (a food of substantially lower quality). Each male was raised singly and so represents an independent sampling unit. The eye spans (the distance between the eyes) were recorded in millimeters. The raw data, which are plotted as histograms below, are as follows: Corn diet: 2.15, 2.14, 2.13, 2.13, 2.12, 2.11, 2.1, 2.08, 2.08, 2.08, 2.04, 2.05, 2.03, 2.02, 2.01, 2, 1.99, 1.96, 1.95, 1.93, 1.89Cotton diet: 2.12, 2.07, 2.01, 1.93, 1.77, 1.68, 1.64, 1.61, 1.59, 1.58, 1.56, 1.55, 1.54, 1.49, 1.45, 1.43, 1.39, 1.34, 1.33, 1.29, 1.26, 1.24, 1.11, 1.05 a) what is the…arrow_forwardA local church is interested in determining how length of residence in the present community relates to church attendance. Using a random sample of 15 individuals, they gathered data on how many times in the previous 5 weeks each individual attended church services. The data are provided below. Length of residence in the community Less than 2 years 2-5 years More than 5 years 0 0 1 1 2 3 3 3 3 4 4 4 4 5 4 Using the 5-step model, determine whether and how church attendance is related to length of residence in the community. Use 5% and 1% levels of statistical significance. What are the assumptions for this problem?arrow_forward27. An article in Radio Engineering and Electronic Physics (1980, Vol. 25, pp. 74-79) investigated the behavior of a stochastic generator in the presence of external noise. The number of periods was measured in a sample of 100 trains for each of two different levels of noise voltage, 100 and 150 mV. For 100 mV, the mean number of periods in a train was 7.9 with s1 = 2.6. For 150 mV, the mean was 6.9 with s2 = 2.4. Use α = 0.01 and assume that each population is normally distributed and the two population variances are equal. (a) It was originally suspected that raising noise voltage would reduce mean number of periods. Do the data support this claim? (b) Calculate a confidence interval to answer the question in part (a).arrow_forward
- Question 9 A well-known brokerage firm executive claimed that 60% of investors are currently confident of meeting their investment goals. An XYZ Investor Optimism Survey, conducted over a two week period, found that in a sample of 100 people, 61% of them said they are confident of meeting their goals.Test the claim that the proportion of people who are confident is larger than 60% at the 0.10 significance level.The null and alternative hypothesis would be: H0:μ≤0.6H0:μ≤0.6H1:μ>0.6H1:μ>0.6 H0:p≥0.6H0:p≥0.6H1:p<0.6H1:p<0.6 H0:p≤0.6H0:p≤0.6H1:p>0.6H1:p>0.6 H0:μ≥0.6H0:μ≥0.6H1:μ<0.6H1:μ<0.6 H0:μ=0.6H0:μ=0.6H1:μ≠0.6H1:μ≠0.6 H0:p=0.6H0:p=0.6H1:p≠0.6H1:p≠0.6 The test is: left-tailed right-tailed two-tailed The test statistic is: (to 2 decimals)The p-value is: (to 4 decimals)Based on this we: Fail to reject the null hypothesis Reject the null hypothesisarrow_forwardIn a base-rate neglect experiment, subjects are randomly divided into two groups, namely A and B. Subjects in Group A are told that Max has been randomly drawn from a population of 95% nurses and 5% doctors. Subjects in Group B are told that Max has been randomly drawn from a population of 5% nurses and 95% doctors. All subjects from both groups are provided with the following description about Max: Max lives in a beautiful house and drives an expensive car; he invests a lot of time in his career. All subjects from both groups are told that the probability that Max fits the description given that he is a doctor is 80%, and the probability that Max fits the description given that he is a nurse is 20%. All subjects from both groups are then asked to estimate the probability that Max is a doctor given that he fits the description. 1. Suppose subjects in Group A correctly use the probability theory. What should be their estimate? From this please explain why this experiment can test…arrow_forwardQuestion 17: A well-known brokerage firm executive claimed that 90% of investors are currently confident of meeting their investment goals. An XYZ Investor Optimism Survey, conducted over a two week period, found that in a sample of 100 people, 81% of them said they are confident of meeting their goals.Test the claim that the proportion of people who are confident is smaller than 90% at the 0.05 significance level.The null and alternative hypothesis would be: H0:p≤0.9H0:p≤0.9H1:p>0.9H1:p>0.9 H0:μ≤0.9H0:μ≤0.9H1:μ>0.9H1:μ>0.9 H0:μ≥0.9H0:μ≥0.9H1:μ<0.9H1:μ<0.9 H0:μ=0.9H0:μ=0.9H1:μ≠0.9H1:μ≠0.9 H0:p=0.9H0:p=0.9H1:p≠0.9H1:p≠0.9 H0:p≥0.9H0:p≥0.9H1:p<0.9H1:p<0.9 The test is: two-tailed right-tailed left-tailed The test statistic is: (to 3 decimals)The p-value is: (to 4 decimals)Based on this we: Fail to reject the null hypothesis Reject the null hypothesisarrow_forward
- If the value of Cronbach’s alpha is 0.07, it means ___________; a. Research instrument is not reliable b. Research instrument is internally consistent c. Data is reliable d. Data is internally consistentarrow_forwardResearchers interested in lead exposure due to car exhaust sampled the blood of 52 police officers subjected to constant inhalation of automobile exhaust fumes while working traffic enforcement in a primarily urban environment. The blood samples of these officers had an average lead concentration of 124.32 µg/l and a SD of 37.74 µg/l; a previous study of individuals from a nearby suburb, with no history of exposure, found an average blood level concentration of 35 µg/l. Test the hypothesis that the downtown police officers have a higher lead exposure than the group in the previous study. Interpret your results in context. Based on your preceding result, without performing a calculation, would a 99% confidence interval for the average blood concentration level of police officers contain 35 µg/l? Based on your preceding result, without performing a calculation, would a 99% confidence interval for this difference contain 0? Explain why or why not.arrow_forwardAn automotive engineer is investigating two different types of metering devices for an electronic fuel injection system to determine whether they differ in their fuel mileage performance. The system is installed on 10 different cars, and a test is run with each metering device on each car. The data is provided below: Metering Device Car 1 2 1 17.6 16.8 2 19.4 20.0 3 18.2 17.6 4 17.1 16.4 5 15.3 16.0 6 15.9 15.9 7 16.3 16.5 8 18.0 18.4 9 17.3 16.4 10 19.1 20.1 Is there a significant difference between the means of the two metering devices? Use . Interpret the result in the context of the problem. An article in the journal Hazardous Waste and Hazardous Materials (Vol. 6, 1989) reported the results of an analysis of the weight of calcium in standard cement and cement doped with lead. Reduced levels of calcium would indicate that the hydration mechanism in the cement is blocked…arrow_forward
 MATLAB: An Introduction with ApplicationsStatisticsISBN:9781119256830Author:Amos GilatPublisher:John Wiley & Sons Inc
 Probability and Statistics for Engineering and th...StatisticsISBN:9781305251809Author:Jay L. DevorePublisher:Cengage Learning
 Statistics for The Behavioral Sciences (MindTap C...StatisticsISBN:9781305504912Author:Frederick J Gravetter, Larry B. WallnauPublisher:Cengage Learning
 Elementary Statistics: Picturing the World (7th E...StatisticsISBN:9780134683416Author:Ron Larson, Betsy FarberPublisher:PEARSON
 The Basic Practice of StatisticsStatisticsISBN:9781319042578Author:David S. Moore, William I. Notz, Michael A. FlignerPublisher:W. H. Freeman
 Introduction to the Practice of StatisticsStatisticsISBN:9781319013387Author:David S. Moore, George P. McCabe, Bruce A. CraigPublisher:W. H. Freeman