
Concept explainers
Videos
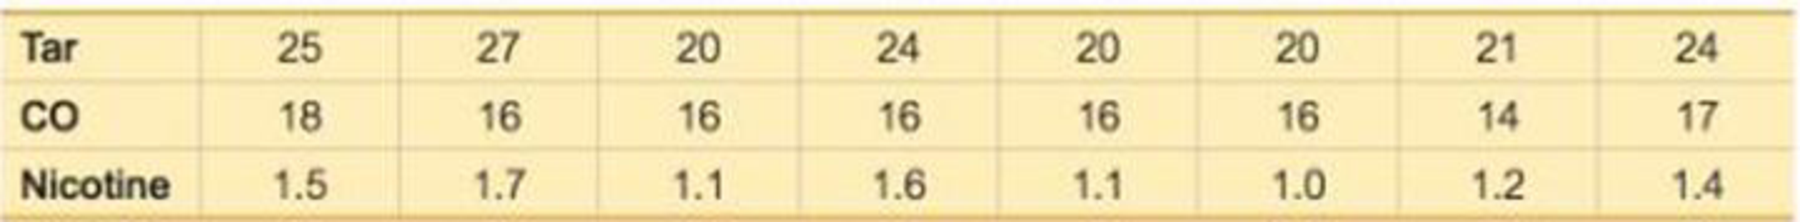
4. Multiple Regression with Cigarettes Use the sample data given in Review Exercise 1 “Cigarette Tar and Nicotine.”
a. Find the multiple regression equation with the response (y) variable of amount of nicotine and predictor (x) variables of amounts of tar and carbon monoxide.
b. Identify the value of the multiple coefficient of determination R2, the adjusted R2, and the P-value representing the overall significance of the multiple regression equation.
c. Use a 0.05 significance level and determine whether the regression equation can be used to predict the amount of nicotine given the amounts of tar and carbon monoxide.
d. The Raleigh brand king size cigarette is not included in the table, and it has 23 mg of tar and 15 mg of carbon monoxide. What is the best predicted amount of nicotine? How does the predicted amount compare to the actual amount of 13 mg of nicotine?
Want to see the full answer?
Check out a sample textbook solution
Chapter 10 Solutions
ELEMENTARY STATISTICS-ACCESS >CUSTOM<


- Life Expectancy The following table shows the average life expectancy, in years, of a child born in the given year42 Life expectancy 2005 77.6 2007 78.1 2009 78.5 2011 78.7 2013 78.8 a. Find the equation of the regression line, and explain the meaning of its slope. b. Plot the data points and the regression line. c. Explain in practical terms the meaning of the slope of the regression line. d. Based on the trend of the regression line, what do you predict as the life expectancy of a child born in 2019? e. Based on the trend of the regression line, what do you predict as the life expectancy of a child born in 1580?2300arrow_forwardFor the following exercises, use Table 4 which shows the percent of unemployed persons 25 years or older who are college graduates in a particular city, by year. Based on the set of data given in Table 5, calculate the regression line using a calculator or other technology tool, and determine the correlation coefficient. Round to three decimal places of accuracyarrow_forwardXYZ Corporation Stock Prices The following table shows the average stock price, in dollars, of XYZ Corporation in the given month. Month Stock price January 2011 43.71 February 2011 44.22 March 2011 44.44 April 2011 45.17 May 2011 45.97 a. Find the equation of the regression line. Round the regression coefficients to three decimal places. b. Plot the data points and the regression line. c. Explain in practical terms the meaning of the slope of the regression line. d. Based on the trend of the regression line, what do you predict the stock price to be in January 2012? January 2013?arrow_forward
- For the following exercises, consider the data in Table 5, which shows the percent of unemployed in a city ofpeople25 years or older who are college graduates is given below, by year. 41. Based on the set of data given in Table 7, calculatethe regression line using a calculator or othertechnology tool, and determine the correlationcoefficient to three decimal places.arrow_forwardLet x be the weight of a car (in hundreds of pounds), and let y be the miles per gallon (mpg). Suppose a car weighs 3800 pounds. What does the data forecast for the miles per gallon expected? x= 27 44 32 47 23 40 34 52 y= 30 19 24 13 29 17 21 14 State the correlation coefficient and state the regression lin equation.arrow_forwardThe data show the chest size and weight of several bears. Find the regression equation, letting chest size be the independent (x) variable. Then find the best predicted weight of a bear with a chest size of 51 inches. Is the result close to the actual weight of 595 pounds? Use a significance level of 0.05. Chest size (inches) Weight (pounds) Click the icon to view the critical values of the Pearson correlation coefficient r. 2 What is the regression equation? y=+x (Round to one decimal place as needed.) What is the best predicted weight of a bear with a chest size of 51 inches? The best predicted weight for a bear with a chest size of 51 inches is pounds. (Round to one decimal place as needed.) Is the result close to the actual weight of 595 pounds? OA. This result is close to the actual weight of the bear. OB. This result is exactly the same as the actual weight of the bear. OC. This result is very close to the actual weight of the bear. OD. This result is not very close to the actual…arrow_forward
- Listed below are paired data consisting of movie budget amounts and the amounts that the movies grossed. Find the regression equation, letting the budget be the predictor (x) variable. Find the best predicted amount that a movie will gross if its budget is $120 million. Use a significance level of alpha equals 0.05. a. The regression equation is y= (Round to one decimal place as needed.) b. The best predicted gross for a movie with a $120 million budget is million. (Round to one decimal place as needed.)arrow_forwardA professor at the University of Alabama was interested in evaluating the relationship between family support and delinquency. Using data collected on 4545 families, the researcher used regression to analyze the relationship. The results are presented below. Variables Entered/Removeda Model Variables Entered Variables Removed Method 1 Family supportb . Enter a. Dependent Variable: Delinquency b. All requested variables entered. Model Summary Model R R Square Adjusted R Square Std. Error of the Estimate 1 .249a .062 .062 1.59168 a. Predictors: (Constant), Family support ANOVAa Model Sum of Squares df Mean Square F Sig. 1 Regression 759.204 1 759.204 299.671 <.001b Residual 11479.107 4531 2.533 Total 12238.311 4532 a. Dependent Variable: Delinquency b. Predictors: (Constant), Family support…arrow_forwardA professor at the University of Alabama was interested in evaluating the relationship between family support and delinquency. Using data collected on 4545 families, the researcher used regression to analyze the relationship. The results are presented below. Variables Entered/Removeda Model Variables Entered Variables Removed Method 1 Family supportb . Enter a. Dependent Variable: Delinquency b. All requested variables entered. Model Summary Model R R Square Adjusted R Square Std. Error of the Estimate 1 .249a .062 .062 1.59168 a. Predictors: (Constant), Family support ANOVAa Model Sum of Squares df Mean Square F Sig. 1 Regression 759.204 1 759.204 299.671 <.001b Residual 11479.107 4531 2.533 Total 12238.311 4532 a. Dependent Variable: Delinquency b. Predictors: (Constant), Family support…arrow_forward
- A professor at the University of Alabama was interested in evaluating the relationship between family support and delinquency. Using data collected on 4545 families, the researcher used regression to analyze the relationship. The results are presented below. Variables Entered/Removeda Model Variables Entered Variables Removed Method 1 Family supportb . Enter a. Dependent Variable: Delinquency b. All requested variables entered. Model Summary Model R R Square Adjusted R Square Std. Error of the Estimate 1 .249a .062 .062 1.59168 a. Predictors: (Constant), Family support ANOVAa Model Sum of Squares df Mean Square F Sig. 1 Regression 759.204 1 759.204 299.671 <.001b Residual 11479.107 4531 2.533 Total 12238.311 4532 a. Dependent Variable: Delinquency b. Predictors: (Constant), Family support…arrow_forwarddetermine the regression equation and the correlation coefficient. can you conclude there is a significant linear correlation between the drug dosage and the average heart rate reduction. what does coefficient of determination tell us about the percentage of variation in average heart rate reductionarrow_forwardGiven below are results from the regression analysis where the dependent variable is the number of weeks a worker is unemployed due to a layoff (Unemploy) and the independent variables are the age of the worker (Age) and a dummy variable for management position (Manager: 1 = yes, 0 = no). The results of the regression analysis are given below. Click the icon to view the results. Determine whether the following statement is true or false: There is sufficient evidence that age has an effect on the number of weeks a worker is unemployed due to a layoff while holding constant the effect of the other independent variable at a 10% level of significance. Regression Statistics False True Regression Statistics Multiple R 0.6391 R Square 0.4085 Adjusted R Square 0.3765 Standard Error 18.8929 Observations 40 ANOVA df SS MS Significance F Regression 2 9119.0897 4559.5448 12.7740 0.0000 Residual 37 13206.8103 356.9408 Total 39 22325.9 Coefficients Standard Error t Stat P-value Intercept -0.2143…arrow_forward
 Functions and Change: A Modeling Approach to Coll...AlgebraISBN:9781337111348Author:Bruce Crauder, Benny Evans, Alan NoellPublisher:Cengage Learning
 Glencoe Algebra 1, Student Edition, 9780079039897...AlgebraISBN:9780079039897Author:CarterPublisher:McGraw Hill
 Big Ideas Math A Bridge To Success Algebra 1: Stu...AlgebraISBN:9781680331141Author:HOUGHTON MIFFLIN HARCOURTPublisher:Houghton Mifflin Harcourt