
Concept explainers
Videos
Consider again the scenario described in Problem 4.
- a. The Center for Business Analytics is considering a refund policy for no-shows. No refund would be given for members who do not attend, but nonmembers who do not attend will be refunded 50% of the price. Extend the model you developed in Problem 4 for the Business Intelligence Symposium to account for the fact that, historically, 25% of members who registered do not show and 10% of registered nonmembers do not attend. The center pays the caterer for breakfast and lunch based on the number of registrants (not the number of attendees). However, the center pays for parking only for those who attend. What is the profit if each corporate member registers their full allotment of tickets and 127 nonmembers register?
- b. Use a two-way data table to show how profit changes as a
function of number of registered nonmembers and the no-show percentage of nonmembers. Vary the number of nonmember registrants from 80 to 160 in increments of 5 and the percentage of nonmember no-shows from 10 to 30% in increments of 2%.
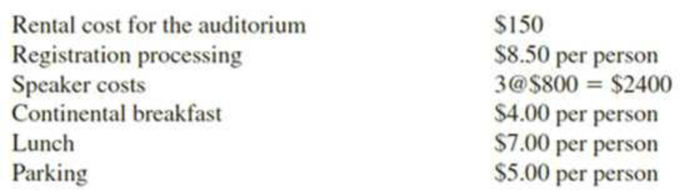
4. The University of Cincinnati Center for Business Analytics is an outreach center that collaborates with industry partners on applied research and continuing education in business analytics. One of the programs offered by the center is a quarterly Business Intelligence Symposium. Each symposium features three speakers on the real-world use of analytics. Each corporate member of the center (there are currently 10) receives five free seats to each symposium. Nonmembers wishing to attend must pay $75 per person. Each attendee receives breakfast, lunch, and free parking. The following are the costs incurred for putting on this
- a. Build a spreadsheet model that calculates a profit or loss based on the number of nonmember registrants.
- b. Use Goal Seek to find the number of nonmember registrants that will make the event break even.
a.
Calculate the profit if each corporate member registers their full allotment of tickets and 127 non-members register.
Answer to Problem 5P
The required profit is $2,288.25.
Explanation of Solution
Calculation:
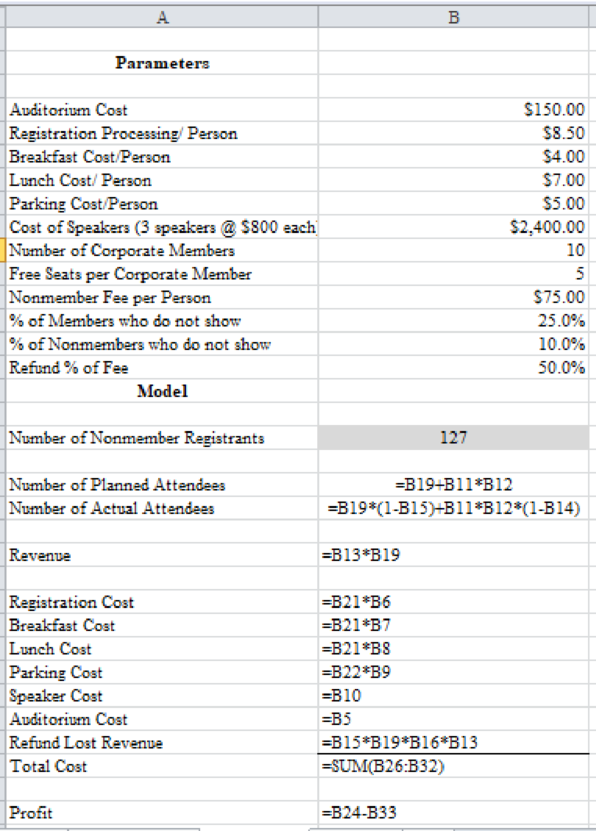
The EXCEL formulas for calculating the profit is displayed below:
The output for the above mentioned formulas is shown below:
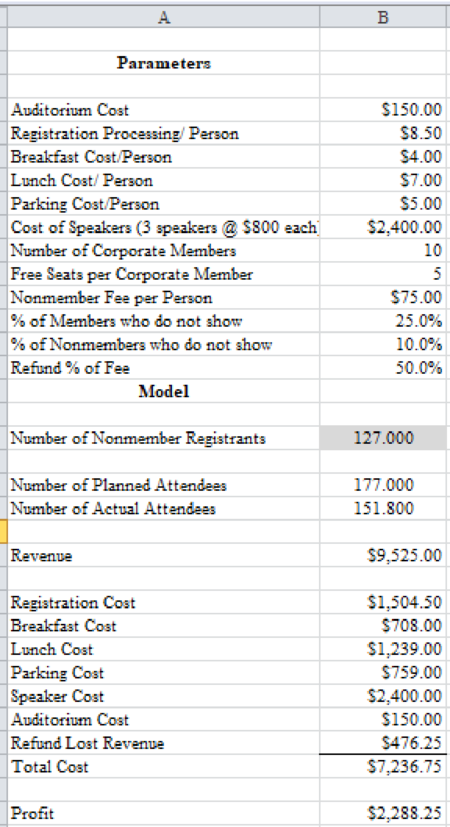
Thus, the required profit is $2,288.25.
b.
Utilise the two-way table to show the change of profit as a function of number of registered non-members and the no-show percentage of non-members using provided information.
Answer to Problem 5P
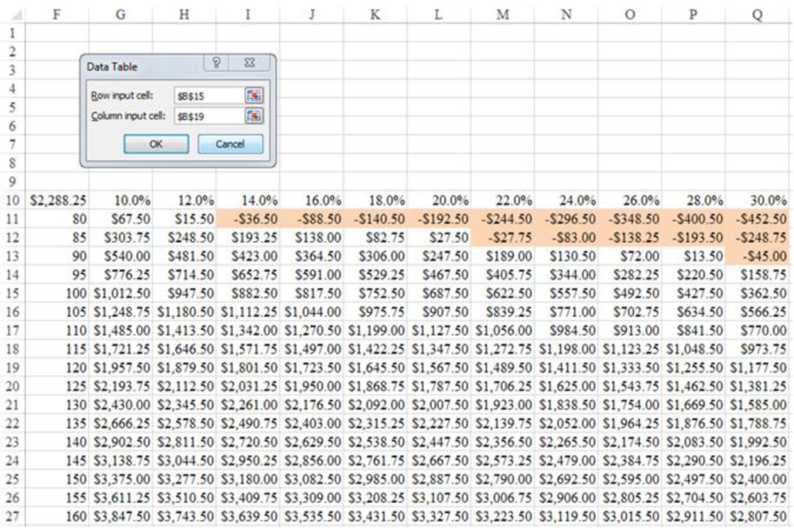
The two-way data table is obtained as follows:
Explanation of Solution
Step-by-step procedure to create a data table using EXCEL is given below:
- Click on Data>What-If-Analysis.
- Select Data Table from the drop-down list.
- Under Row input cell>click on cell $B$15.
- Under Column input cell>click on cell $B$19.
- Click Ok.
The output for two-way data table is thus obtained.
Want to see more full solutions like this?
Chapter 10 Solutions
Essentials of Business Analytics (MindTap Course List)


- According to a study administered by the National Bureau of Economic Research, half of Americans would struggle to come up with $2000 in the event of a financial emergency. The majority of the 1900 Americans surveyed said they would rely on more than one method to come up with emergency funds if required. In the survey, 397 people said that they "certainly" would not be able to cope with an unexpected $2000 bill if they had to come up with the money in 30 days, and 553 people said they "probably" would not be able to cope. Step 1 of 2 : What percentage of Americans "certainly" would not be able to produce $2000 in the event of an emergency according to the study? Round your answer to one decimal place, if necessary.arrow_forwardDiscuss two extensions to the original GARCH (p,q) model and explain additional characteristics of financial data they might be able to capture.arrow_forward1. Referring to Scenario 13-11, which of the following is the correct interpretation for the slopecoefficient?a) For each decrease of 1 thousand downloads, the expected revenue is estimated to increase by $3.7297 thousands.b) For each increase of 1 thousand downloads, the expected revenue is estimated to increase by $3.7297 thousands.c) For each decrease of 1 thousand dollars in expected revenue, the expected number ofdownloads is estimated to increase by 3.7297 thousands.d) For each increase of 1 thousand dollars in expected revenue, the expected number ofdownloads is estimated to increase by 3.7297 thousands.ANSWER:2. Referring to Scenario 13-11, predict the revenue when the number of downloads is 30 thousands.ANSWER:3. Referring to Scenario 13-11, which of the following is the correct interpretation for the coefficient ofdetermination?a) 74.67% of the variation in revenue can be explained by the variation in the number ofdownloads.b) 75.54% of the variation in revenue can be…arrow_forward
- Dave Fletcher, the general manager of North Carolina Engineering Corporation (NCEC), thinks that his firm’s engineer-ing services contracted to highway construction firms are directly related to the volume of highway construction business contractedwith companies in his geographic area. He wonders if this is reallyso, and if it is, can this information help him plan his operationsbetter by forecasting the quantity of his engineering servicesrequired by construction firms in each quarter of the year? Thefollowing table presents the sales of his services and total amountsof contracts for highway construction over the past eight quarters: a) Using this data, develop a regression equation for predictingthe level of demand of NCEC’s services. b) Determine the coefficient of correlation and the standard errorof the estimate.arrow_forwardQUESTION 5 A country club wants to exam the effects of a new marketing campaign that attempts to get more people within the community to become members. In many communities, when people buy a house in the area, they receive a “Welcome Wagon” gift basket containing coupons to local restaurants. The idea of the marketing campaign is to include a free two month membership to the country club in the gift basket with the hope that once “new” residents try the country club then at least a certain proportion will want to become real members. One member of the Club’s Executive Council believes that at least 80% of the people who receive the coupons for the free membership will use the coupon. In a sample of 197 new residents who received the coupon for the two month free membership, there were 136 people who actually took advantage of the free two month membership. When testing the hypothesis that at least 80% of the people that receive the coupon actually use it, what is the test statistic?…arrow_forwardTable 10-2 A problem with a phone line that prevents a customer from receiving or making calls is upsetting to both the customer and the telecommunications company. The file “Phone” contains samples of 20 problems reported to two different offices of a telecommunications company and the time toclear these problems (in minutes) from the customers’ lines: Central Office I Time to Clear Problems (minutes) 1.48 1.75 0.78 2.85 0.52 1.60 4.15 3.97 1.48 3.10 1.02 0.53 0.93 1.60 0.80 1.05 6.32 3.93 5.45 0.97 Central Office II Time to Clear Problems (minutes) 7.55 3.75 0.10 1.10 0.60 0.52 3.30 2.10 0.58 4.02 3.75 0.65 1.92 0.60 1.53 4.23 0.08 1.48 1.65 0.72 Assuming that the population variances from both offices are not equal, is there evidence of a difference in the mean waiting time between two offices? (Use a = 0.01) ▪ You may need to download file “Phone”. Referring to Table 10-2, judging from the way the data were collected, which test would likely be most appropriate to…arrow_forward
 MATLAB: An Introduction with ApplicationsStatisticsISBN:9781119256830Author:Amos GilatPublisher:John Wiley & Sons Inc
 Probability and Statistics for Engineering and th...StatisticsISBN:9781305251809Author:Jay L. DevorePublisher:Cengage Learning
 Statistics for The Behavioral Sciences (MindTap C...StatisticsISBN:9781305504912Author:Frederick J Gravetter, Larry B. WallnauPublisher:Cengage Learning
 Elementary Statistics: Picturing the World (7th E...StatisticsISBN:9780134683416Author:Ron Larson, Betsy FarberPublisher:PEARSON
 The Basic Practice of StatisticsStatisticsISBN:9781319042578Author:David S. Moore, William I. Notz, Michael A. FlignerPublisher:W. H. Freeman
 Introduction to the Practice of StatisticsStatisticsISBN:9781319013387Author:David S. Moore, George P. McCabe, Bruce A. CraigPublisher:W. H. Freeman