
Videos
Consider the following hypothesis test:
The following results are from independent samples taken from two populations.
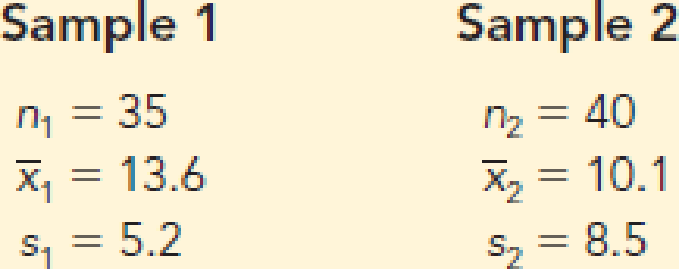
- a. What is the value of the test statistic?
- b. What is the degrees of freedom for the t distribution?
- c. What is the p-value?
- d. At α = .05, what is your conclusion?
Want to see the full answer?
Check out a sample textbook solution
Chapter 10 Solutions
Modern Business Statistics with Microsoft Office Excel (with XLSTAT Education Edition Printed Access Card) (MindTap Course List)


- The P-value for a hypothesis test is 0.06. For each of the fol-lowing significance levels, decide whether the null hypothesis should be rejected. a. α = 0.05b. α = 0.10 c. α = 0.06arrow_forwardA random sample of size 16 from a normal distribution with 0= 3 produced a sample mean of 4.5. a- is the x distribution normal? b-Compute the sample test statistic z under the null hypothesis Ho: u=6.3. c- for H1:u<6.3, estimate the P-value of the test statistic. d-for a level of significance of 0.01 and the hypotheses of parts (b) and (c), do you reject or fail to reject the null hypothesis? Explain.arrow_forwardConsider the following hypothesis test. H0: μ1 − μ2 = 0 Ha: μ1 − μ2 ≠ 0 The following results are for two independent samples taken from the two populations. Sample 1 Sample 2 n1 = 70 n2 = 80 x1 = 106 x2 = 108 σ1 = 8.4 σ2 = 7.6 (a) What is the p-value? (Round your answer to four decimal places. show work not done on calculator) (b) With α = 0.01, using the p-value approach, what is your hypothesis testing conclusion? Why? Explainarrow_forward
- Consider the following hypothesis test: ??:? ≥ 80 ??:? < 80 A sample of 100 is used and the population standard deviation is 12. Compute the critical value and p-value and state your conclusion for each of the following sample results. Use \alpha =0.05 A) ?̅ = 78.5 B) ?̅=77arrow_forwardFind the P-value that corresponds to the given standard score, and determine whether to reject the null hypothesis at the 0.10 significance level. Is the alternative hypothesis supported? z=−1.2 for H0:μ=25 centimeters and Ha:μ<25 centimeters the p value is ?arrow_forwardConsider the following hypothesis test: H0:μ = 15 Ha:μ ≠ 15 A sample of 50 provided a sample mean of 14.15. The population standard deviation is 3. a. Compute the value of the test statistic. b. what is the p-value? c. At α = 0.05, what is your conclusion? d. what is the rejection rule using the critical value? what is your conclusion?arrow_forward
- Consider the hypothesis statement shown below using α=0.01 and the data to the right from two independent samples. H0: μ1−μ2=0 H1: μ1−μ2≠0 a) Calculate the appropriate test statistic and interpret the result. b) Calculate the p-value and interpret the result. x1 = 237 x2 = 258 σ1 = 48 σ2 = 55 n1 = 43 n2 = 37arrow_forwardConsider the following hypothesis statement using α=0.01 and data from two independent samples. Assume the population variances are equal and the populations are normally distributed. Complete parts a and b. H0: μ1−μ2=0 x1=14.5 x2=13.0 H1: μ1−μ2≠0 s1=2.6 s2=3.3 n1=22 n2=15 a. Calculate the appropriate test statistic and interpret the result. The test statistic is? The critical value(s) is(are)? b. Identify the p-value from part a and interpret the result.arrow_forwardIn a test of H0:p=0.4 against Ha:p≠0.4, a sample of size 100 produces z=1.28 for the value of the test statistic. Thus the p-value of the test is approximately equal to?arrow_forward
- A researcher conducts a hypothesis test using a sample of n = 20 with M = 34 and s 2 = 36 from an unknown population. What is the df value for the t statistic?arrow_forwardConsider the following hypothesis statement using α=0.10 and the following data from two independent samples. Complete parts a and b below. H0: p1−p2≥0 x1=74 x2=76 H1: p1−p2<0 n1=125 n2=170 a. Calculate the appropriate test statistic and interpret the result. What is the test statistic? What is/are the critical value(s)? b. Calculate the p-value and interpret the result. What is the p-value?arrow_forwardA random sample of 10 professional athletes produced the following data where X is the number of endorsements the player has and Y is the amount of money made (in millions of dollars). Use the 4 steps of hypothesis testing to see if the prediction is significant with a criteria of alpha=.05 on the following data. x y 0 2 3 8 2 7 1 3 5 13 5 12 4 9 3 9 0 3 4 10arrow_forward
 MATLAB: An Introduction with ApplicationsStatisticsISBN:9781119256830Author:Amos GilatPublisher:John Wiley & Sons Inc
 Probability and Statistics for Engineering and th...StatisticsISBN:9781305251809Author:Jay L. DevorePublisher:Cengage Learning
 Statistics for The Behavioral Sciences (MindTap C...StatisticsISBN:9781305504912Author:Frederick J Gravetter, Larry B. WallnauPublisher:Cengage Learning
 Elementary Statistics: Picturing the World (7th E...StatisticsISBN:9780134683416Author:Ron Larson, Betsy FarberPublisher:PEARSON
 The Basic Practice of StatisticsStatisticsISBN:9781319042578Author:David S. Moore, William I. Notz, Michael A. FlignerPublisher:W. H. Freeman
 Introduction to the Practice of StatisticsStatisticsISBN:9781319013387Author:David S. Moore, George P. McCabe, Bruce A. CraigPublisher:W. H. Freeman