Mathematical Applications for the Management, Life, and Social Sciences
11th Edition
ISBN: 9781305108042
Author: Ronald J. Harshbarger, James J. Reynolds
Publisher: Cengage Learning
expand_more
expand_more
format_list_bulleted
Concept explainers
Videos
Question
Chapter 10.2, Problem 34E
(a)
To determine
The points of inflection from the graph,
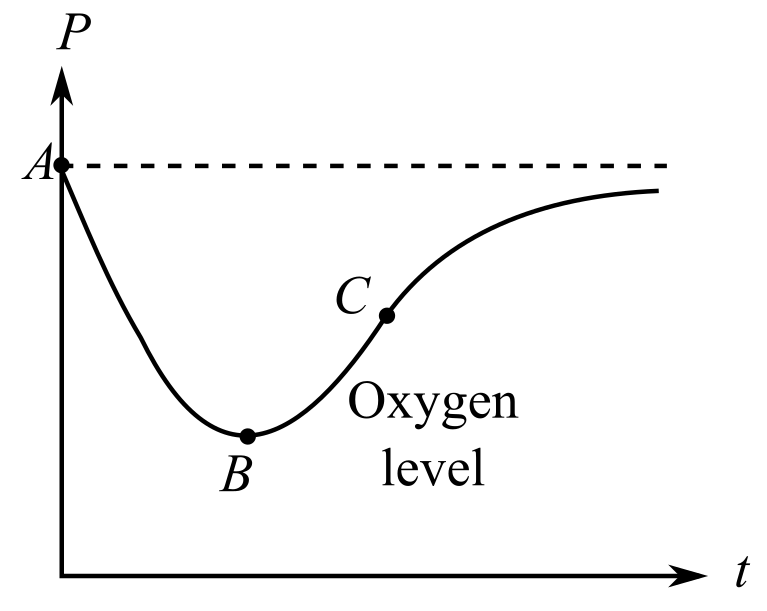
(b)
To determine
The side of C at which
(c)
To determine
Whether the rate of purity attain its minimum at C where the figure represents the oxygen level P in a lake t months after an oil spill
Expert Solution & Answer
Want to see the full answer?
Check out a sample textbook solution
Chapter 10 Solutions
Mathematical Applications for the Management, Life, and Social Sciences
Ch. 10.1 - 1. The x- values of critical points are found...Ch. 10.1 - Prob. 2CPCh. 10.1 - Prob. 3CPCh. 10.1 - Prob. 4CPCh. 10.1 - In Problems 1 and 2, use the indicated points on...Ch. 10.1 - In Problems 1 and 2, use the indicated points on...Ch. 10.1 - 3. Use the graph of in Problem 1 to identify at...Ch. 10.1 - 4. Use the graph of in Problem 2 to identify at...Ch. 10.1 - In Problems 5 and 6, use the sign diagram for to...Ch. 10.1 - In Problems 5 and 6, use the sign diagram for to...
Ch. 10.1 - In Problems 7-10, (a) find the critical values of...Ch. 10.1 - In Problems 7-10, (a) find the critical values of...Ch. 10.1 - In Problems 7-10, (a) find the critical values of...Ch. 10.1 - In Problems 7-10, (a) find the critical values of...Ch. 10.1 - For each function and graph in Problems 11-14
(a)...Ch. 10.1 - Prob. 12ECh. 10.1 - Prob. 13ECh. 10.1 - Prob. 14ECh. 10.1 - For each function in Problems 15-20
(a) find
(b)...Ch. 10.1 - For each function in Problems 15-20
(a) find
(b)...Ch. 10.1 - For each function in Problems 15-20
(a) find
(b)...Ch. 10.1 - For each function in Problems 15-20
(a) find
(b)...Ch. 10.1 - Prob. 19ECh. 10.1 - Prob. 20ECh. 10.1 - Prob. 21ECh. 10.1 - For each function and graph in Problems 21-24
(a)...Ch. 10.1 - Prob. 23ECh. 10.1 - Prob. 24ECh. 10.1 - For each function in Problems 25-30, find the...Ch. 10.1 - Prob. 26ECh. 10.1 - Prob. 27ECh. 10.1 - For each function in Problems 25-30, find the...Ch. 10.1 - Prob. 29ECh. 10.1 - Prob. 30ECh. 10.1 - Prob. 31ECh. 10.1 - Prob. 32ECh. 10.1 - Prob. 33ECh. 10.1 - In Problems 31-36, both a function and its...Ch. 10.1 - Prob. 35ECh. 10.1 - In Problems 31-36, both a function and its...Ch. 10.1 - Prob. 37ECh. 10.1 - Prob. 38ECh. 10.1 - Prob. 39ECh. 10.1 - Prob. 40ECh. 10.1 - Prob. 41ECh. 10.1 - Prob. 42ECh. 10.1 - Prob. 43ECh. 10.1 - Prob. 44ECh. 10.1 - Prob. 45ECh. 10.1 - In each of Problems 43-46, a graph of is given....Ch. 10.1 - Prob. 47ECh. 10.1 - Prob. 48ECh. 10.1 - 49. Advertising and sales Suppose that the daily...Ch. 10.1 - 50. Pricing and sales Suppose that a chain of auto...Ch. 10.1 - 51. Productivity A time study showed that, on...Ch. 10.1 - 52. Production Analysis of daily output of a...Ch. 10.1 - 53. Production costs Suppose that the average...Ch. 10.1 - 54. Average costs Suppose the average costs of a...Ch. 10.1 - 55. Marginal revenue Suppose the weekly marginal...Ch. 10.1 - 56. Earnings Suppose that the rate of change of...Ch. 10.1 - 57. Revenue The weekly revenue of a certain...Ch. 10.1 - 58. Medication Suppose that the concentration C of...Ch. 10.1 - Prob. 59ECh. 10.1 - 60. Medication The number of milligrams x of a...Ch. 10.1 - 61. Worldwide cell phone subscriberships In 2013,...Ch. 10.1 - 62. Economic dependency ratio The economic...Ch. 10.1 - Prob. 63ECh. 10.1 - 64. Modeling Energy from crude oil The table shows...Ch. 10.1 - Prob. 65ECh. 10.2 - 1. If then is concave__________.
Ch. 10.2 - 2. At what value of x does the graph have a point...Ch. 10.2 - 3. On the graph below, locate any points of...Ch. 10.2 - 4. Determine whether the following is true or...Ch. 10.2 - Prob. 1ECh. 10.2 - Prob. 2ECh. 10.2 - In Problems 5-10, use the indicated x-values on...Ch. 10.2 - In Problems 5-10, use the indicated x-values on...Ch. 10.2 - In Problems 5-10, use the indicated x-values on...Ch. 10.2 - In Problems 5-10, use the indicated x-values on...Ch. 10.2 - In Problems 5-10, use the indicated x-values on...Ch. 10.2 - Prob. 8ECh. 10.2 - Prob. 9ECh. 10.2 - Prob. 10ECh. 10.2 - In Problems 11-14, a function and its graph are...Ch. 10.2 - Prob. 12ECh. 10.2 - Prob. 13ECh. 10.2 - Prob. 14ECh. 10.2 - Prob. 15ECh. 10.2 - Prob. 16ECh. 10.2 - Find the relative maxima, relative minima, and...Ch. 10.2 - Find the relative maxima, relative minima, and...Ch. 10.2 - Prob. 19ECh. 10.2 - Prob. 20ECh. 10.2 - Prob. 21ECh. 10.2 - Prob. 22ECh. 10.2 - Prob. 23ECh. 10.2 - Prob. 24ECh. 10.2 - Prob. 25ECh. 10.2 - Prob. 26ECh. 10.2 - In Problems 29 and 30, use the graph shown in the...Ch. 10.2 - In Problems 29 and 30, use the graph shown in the...Ch. 10.2 - In Problems 31 and 32, a graph is given. Tell...Ch. 10.2 - Prob. 30ECh. 10.2 - Prob. 31ECh. 10.2 - Prob. 32ECh. 10.2 - Prob. 33ECh. 10.2 - Prob. 34ECh. 10.2 - 37. Production Suppose that the total number of...Ch. 10.2 - 38. Poiscuille's law—velocity of blood According...Ch. 10.2 - 39. Advertising and sales—diminishing returns...Ch. 10.2 - 40. Oxygen purity—diminishing returns Suppose that...Ch. 10.2 - Prob. 39ECh. 10.3 - 1. True or false: If is the total revenue...Ch. 10.3 - Prob. 2CPCh. 10.3 - Prob. 3CPCh. 10.3 - Prob. 4CPCh. 10.3 - Prob. 1ECh. 10.3 - Prob. 2ECh. 10.3 - In Problems 1-6, find the absolute maxima and...Ch. 10.3 - 7. (a) If the total revenue function for a hammer...Ch. 10.3 - 8. (a) If the total revenue function for a blender...Ch. 10.3 - 9. If the total revenue function for a computer is...Ch. 10.3 - 10. A firm has total revenues given by
for x...Ch. 10.3 - 11. An agency charges $100 per person for a trip...Ch. 10.3 - 12. A company handles an apartment building with...Ch. 10.3 - 13. A cable TV company has 4000 customers paying...Ch. 10.3 - 14. If club members charge $5 admission to a...Ch. 10.3 - Prob. 13ECh. 10.3 - 16. For the revenue function given by
(a) find...Ch. 10.3 - 17. If the total cost function for a lamp is ...Ch. 10.3 - 18. If the total cost function for a product is ...Ch. 10.3 - 19. If the total cost function for a product is ...Ch. 10.3 - Prob. 18ECh. 10.3 - 21. If the total cost function for a product is ...Ch. 10.3 - 22. If the total cost function for a product is ...Ch. 10.3 - 23. For the cost function , show that average...Ch. 10.3 - 24. For the cost function , show that average...Ch. 10.3 - The graphs in Problems 25 and 26 show total cost...Ch. 10.3 - Prob. 24ECh. 10.3 - 27. If the profit function for a product is ...Ch. 10.3 - 28. If the profit function for a commodity is ...Ch. 10.3 - 29. A manufacturer estimates that its product can...Ch. 10.3 - 30. A product can be produced at a total cost ...Ch. 10.3 - 31. A firm can produce only 1000 units per month....Ch. 10.3 - 32. A firm can produce 100 units per week. If its...Ch. 10.3 - 33. A company handles an apartment building with...Ch. 10.3 - 34. A travel agency will plan a tour for groups of...Ch. 10.3 - 35. A firm has monthly average costs, in dollars,...Ch. 10.3 - 36. A small business has weekly average costs, in...Ch. 10.3 - 37. The weekly demand function for x units of a...Ch. 10.3 - 38. The monthly demand function for x units of a...Ch. 10.3 - 39. The monthly demand function for a product sold...Ch. 10.3 - 40. The monthly demand function for x units of a...Ch. 10.3 - 41. An industry with a monopoly on a product has...Ch. 10.3 - 42. A large corporation with monopolistic control...Ch. 10.3 - 43. Coastal Soda Sales has been granted exclusive...Ch. 10.3 - Prob. 47ECh. 10.3 - Prob. 48ECh. 10.3 - Prob. 49ECh. 10.4 - Suppose we want to find the minimum value of and...Ch. 10.4 - Prob. 2CPCh. 10.4 - Prob. 3CPCh. 10.4 - 1. Return to sales The manufacturer of GRIPPER...Ch. 10.4 - 2. Projectiles A ball thrown into the air from a...Ch. 10.4 - 3. Profit The profit per acre from a grove of...Ch. 10.4 - 4. Reaction rates The velocity v of an...Ch. 10.4 - 5. Productivity Analysis of daily output of a...Ch. 10.4 - 6. Productivity A time study showed that, on...Ch. 10.4 - Prob. 7ECh. 10.4 - 8. Production costs Suppose that the monthly cost...Ch. 10.4 - Prob. 9ECh. 10.4 - Medication For Problems 9 and 10, consider that...Ch. 10.4 - 11. Advertising and sales An inferior product with...Ch. 10.4 - Prob. 12ECh. 10.4 - 13. News impact Suppose that the percent p (as a...Ch. 10.4 - 14. Candidate recognition Suppose that in an...Ch. 10.4 - 15. Minimum fence Two equal rectangular lots are...Ch. 10.4 - 16. Minimum fence The running yard for a dog...Ch. 10.4 - Minimum cost A rectangular field with one side...Ch. 10.4 - Prob. 18ECh. 10.4 - 19. Optimization at a fixed cost A rectangular...Ch. 10.4 - Minimum cost A kennel of 640 square feet is to be...Ch. 10.4 - Minimum cost The base of a rectangular box is to...Ch. 10.4 - Prob. 22ECh. 10.4 - 23. Inventory cost model Suppose that a company...Ch. 10.4 - Inventory cost model Suppose that a company needs...Ch. 10.4 - Inventory cost model A company needs 150,000 items...Ch. 10.4 - Inventory cost model A company needs 450,000 items...Ch. 10.4 - 27. Volume A rectangular box with a square base is...Ch. 10.4 - Prob. 28ECh. 10.4 - 29. Revenue The owner of an orange grove must...Ch. 10.4 - 30. Minimum material
(a) A box with an open top...Ch. 10.4 - 31. Minimum cost A printer has a contract to print...Ch. 10.4 - 32. Shortest time A vacationer on an island 8...Ch. 10.4 - Prob. 33ECh. 10.5 - Prob. 1CPCh. 10.5 - Prob. 2CPCh. 10.5 - In Problems 1-4, a function and its graph are...Ch. 10.5 - Prob. 2ECh. 10.5 - Prob. 3ECh. 10.5 - Prob. 4ECh. 10.5 - Prob. 5ECh. 10.5 - Prob. 6ECh. 10.5 - Prob. 7ECh. 10.5 - Prob. 8ECh. 10.5 - Prob. 9ECh. 10.5 - Prob. 10ECh. 10.5 - Prob. 11ECh. 10.5 - Prob. 12ECh. 10.5 - Prob. 13ECh. 10.5 - Prob. 14ECh. 10.5 - Prob. 15ECh. 10.5 - Prob. 16ECh. 10.5 - Prob. 17ECh. 10.5 - Prob. 18ECh. 10.5 - Prob. 19ECh. 10.5 - In Problems 19-24, a function and its first and...Ch. 10.5 - Prob. 21ECh. 10.5 - Prob. 22ECh. 10.5 - Prob. 23ECh. 10.5 - Prob. 24ECh. 10.5 - Prob. 25ECh. 10.5 - Prob. 26ECh. 10.5 - Prob. 27ECh. 10.5 - Prob. 28ECh. 10.5 - Prob. 29ECh. 10.5 - Prob. 30ECh. 10.5 - Prob. 31ECh. 10.5 - For each function in Problems 29-34, complete the...Ch. 10.5 - Prob. 33ECh. 10.5 - Prob. 34ECh. 10.5 - Prob. 35ECh. 10.5 - Prob. 36ECh. 10.5 - 37. Revenue A recently released film has its...Ch. 10.5 - Prob. 38ECh. 10.5 - Prob. 39ECh. 10.5 - 40. Profit An entrepreneur starts new companies...Ch. 10.5 - 41. Productivity The figure is a typical graph of...Ch. 10.5 - Prob. 42ECh. 10.5 - 43. Females in the workforce For selected years...Ch. 10 - In Problems 1-4, find all critical points and...Ch. 10 - Prob. 2RECh. 10 - Prob. 3RECh. 10 - Prob. 4RECh. 10 - Prob. 5RECh. 10 - Prob. 6RECh. 10 - Prob. 7RECh. 10 - Prob. 8RECh. 10 - Prob. 9RECh. 10 - Prob. 10RECh. 10 - Prob. 11RECh. 10 - Prob. 12RECh. 10 - Prob. 13RECh. 10 - Prob. 14RECh. 10 - Prob. 15RECh. 10 - Prob. 16RECh. 10 - Prob. 17RECh. 10 - Prob. 18RECh. 10 - Prob. 19RECh. 10 - Prob. 20RECh. 10 - Prob. 21RECh. 10 - Prob. 22RECh. 10 - Prob. 23RECh. 10 - Prob. 24RECh. 10 - Prob. 25RECh. 10 - Prob. 26RECh. 10 - Prob. 27RECh. 10 - Prob. 28RECh. 10 - Prob. 29RECh. 10 - Prob. 30RECh. 10 - Prob. 31RECh. 10 - Prob. 32RECh. 10 - Prob. 33RECh. 10 - Prob. 34RECh. 10 - Prob. 35RECh. 10 - Prob. 36RECh. 10 - Prob. 37RECh. 10 - 38. Productivity—diminishing returns Suppose the...Ch. 10 - Prob. 39RECh. 10 - Prob. 40RECh. 10 - Prob. 41RECh. 10 - Prob. 42RECh. 10 - Prob. 43RECh. 10 - Prob. 44RECh. 10 - 45. Reaction to a drug The reaction R to an...Ch. 10 - Prob. 46RECh. 10 - 47. Population Population estimates show that the...Ch. 10 - Prob. 48RECh. 10 - 49. Product design A playpen manufacturer wants to...Ch. 10 - Prob. 50RECh. 10 - Prob. 51RECh. 10 - Prob. 52RECh. 10 - 53. Inventory cost model A company needs to...Ch. 10 - Prob. 54RECh. 10 - Prob. 55RECh. 10 - Prob. 1TCh. 10 - Prob. 2TCh. 10 - Prob. 3TCh. 10 - Prob. 4TCh. 10 - Prob. 5TCh. 10 - Prob. 6TCh. 10 - Prob. 7TCh. 10 - Prob. 8TCh. 10 - 9. Use the following graph of y = f(x) and the...Ch. 10 - Prob. 10TCh. 10 - Prob. 11TCh. 10 - Prob. 12TCh. 10 - 13. The revenue function for a product is dollars...Ch. 10 - Prob. 14TCh. 10 - 15. A firm sells 100 TVs per month at $300 each,...Ch. 10 - 16. An open-top box is made by cutting squares...Ch. 10 - Prob. 17T
Knowledge Booster


Learn more about
Need a deep-dive on the concept behind this application? Look no further. Learn more about this topic, subject and related others by exploring similar questions and additional content below.Similar questions
- Earthquake the graph shows the vertical acceleration of the Ground from the 1994 Northridge earthquake in Los Angles, as measured by a seismograph. (Here t represents the time in seconds.) (a) At what time t did the earthquake first make noticeable movement of the Earth? (b) At what time t did the earthquakes seem to end? (c) At what time t was the maximum intensity of the earthquake list reachedarrow_forwardPopulation Statistics The table shows the life expectancies of a child (at birth) in the United States for selected years from 1940 through 2010. A model for the life expectancy during this period is y=63.6+0.97t1+0.01t,0t70 Where y represents the life expectancy and t is the time in years, with t = 0 corresponding to 1940. (a) Use a graphing utility to graph the data from the table and the model in the same viewing window. How well does the model fit the data? Explain. (b) Determine the life expectancy in 1990 both graphically and algebraically. (c) Use the graph to determine the year when life expectancy was approximately 70.1. verify your answer algebraically. (d) Find the y-intercept of the graph of the model. What does it represent in the context of the problem? (e) Do you think this model can be used to predict the life expectancy of a child 50 years from now?arrow_forwardMonthly Payment for a Home: If you borrow 120,000 at an APR of 6 in order to buy a home, and if the lending institution compounds interest continuously, then your monthly payment M=M(Y), in dollars, depends on the number of years Y you take to pay off the loan. The relationship is given by M=120,000(e0.0051)1e0.06Y. a. Make a graph of M versus Y. in choosing a graphing window, you should note that a home mortgage rarely extends beyond 30 years. b. Express in functional notation your monthly payment if you pay off the loan in 20 years, and then use the graph to find that value. c. Use the graph to find your monthly payment if you pay off the loan in 30 years. d. From part b to part c of this exercise, you increased the debt period by 50. Did this decrease your monthly payment by 50? e. Is the graph concave up or concave down? Explain your answer in practical terms. f. Calculate the average decreases per year in your monthly payment from a loan period of 25 to a loan period of 30 years.arrow_forward
- Flood Control A river is 8 feet above its flood stage. The water is receding at a rate of 3 inches per hour. Write a mathematical model that shows the number of feet above flood stage after t hours. Assuming the water continually recedes at this rate, when will the river be 1 foot above its flood stage?arrow_forwardLidocaine Lidocaine is a drug used to treat irregular heartbeats. After an injection of a 100-mg dose of lidocaine, the amount of the drug in a patients bloodstream is 33.67(e0.0075731te0.12043t)mg at time t minutes after the injection. a. Make a graph of the amount of drug in the bloodstream for t up to 4 hours 240 minutes. b. When does the drug reach its maximum level in the bloodstream? c. For a person of typical size, the drug is effective as long as the amount in the bloodstream is at least 7.5 mg. For how long is the drug at or above that level? Hint: The drug is at that level twice. d. For a person of typical size, the lethal level occurs when the amount in the bloodstream exceeds 30 mg. Is this dose lethal for such a person? e. For a small person, the lethal level occurs when the amount in the bloodstream exceeds 15 mg. Is this dose lethal for such a person? If so, after how many minutes will it be lethal?arrow_forwardPopulation Statistics The table shows the life expectancies of a child (at birth) in the United States for selected years from 1940 through 2010. A model for the life expectancy during this period is y=63.6+0.97t1+0.01t,0r70 Where y represents the life expectancy and t is the time in years, with t=0 corresponding to 1940. (a) Use a graphing utility to graph the data from the table and the model in the same viewing window. How well does the model fit the data? Explain (b) Determine the life expectancy in 1990 both graphically and algebraically. (c) Use the graph to determine the year when life expectancy was approximately 70.1. Verify your answer algebraically. (d) Identify the y-intercept of the graph of the model. What does it represent in the context of the problem? (e) Do you think this model can be used to predict the life expectancy of a child 50 years from now? Explainarrow_forward
- Suppose that average annual income (in dollars) forthe years 1990 through 1999 is given by the linearfunction: I(x)=1,054x+23,286 , where x is thenumber of years after 1990. Which of the followinginterprets the slope in the context of the problem? a. As of 1990, average annual income was $23,286. b. In the ten-year period from 1990-1999, averageannual income increased by a total of $1,054. c. Each year in the decade of the 1990s, averageannual income increased by $1,054. d. Average annual income rose to a level of $23,286 bythe end of 1999.arrow_forwardMarine Fishery One class of models for population growth rates in marine fisheries assumes that the harvest from fishing is proportional to the population size. For one such model, we have G=0.3n(1n2)0.1n Here G is the growth rate of the population, in millions of tons of fish per year, and n is the population size, in millions of tons of fish. a.Make a graph of G versus n. include values of n up to 1.5 million tons. b.Use functional notation to express the growth rate if the population size is 0.24 million tons, and then calculate that value. c. Calculate G1.42 and explain in practical terms what your answer means. d.At what population size is the growth rate the largest?arrow_forwardDrug Concentration When a drug is administered orally, it takes some time before the blood concentration reaches its maximum level. After that time, concentration levels decrease. When 500 milligrams of procainamide is administered orally, one model for a particular patient gives blood concentration C, in milligrams per liter, after t hours as C=2.65(e0.2te2t) What is the maximum blood-level concentration, and when does that level occur?arrow_forward
- Baking a Potato: A potato is placed in a preheated oven to bake. Its temperature P=P(t) is given by P=400325et/50, Where P is measured in degrees Fahrenheit and t is the time in minutes since the potato was placed in the oven. a. Make a graph of P versus t.Suggestion: in choosing your graphing window, it is reasonable to look at the potato over no more than a 2-hour period. After that, it will surely be burned to a crisp. You may wish to look at a table of values to select a vertical span. b. What was the initial temperature of the potato? c. Did the potatos temperature rise more during the first 30 minutes or second 30 minutes of baking? What was the average rate of change per minute during the first 30 minutes? What was the average rate of change per minute during the second 30 minutes. d. Is this graph concave up or concave down? Explain what that tells you about how the potato heats up, and relate this to part c.. e. The potato will be done when it reaches a temperature of 270 degrees. Approximate the time when the potato will be done. f. What is the temperature of the oven? Explain how you got your answer. Hint: if the potato were left in the oven for a long time, its temperature would match that of the oven.arrow_forwardSales Growth In this exercise, we develop a model for the growth rate G, in thousands of dollars per year, in sales of the product as a function of the sales level s, in thousands of dollars. The model assumes that there is a limit to the total amount of sales that can be attained. In this situation, we use the term unattained sales for difference this limit and the current sales level. For example, if we expect sales grow to 3 thousand dollars in the long run, then 3-s is the unattained sales. The model states that the growth rate G is proportional to the product of the sales level s, and the unattained sales. Assume that the constant of proportionality is 0.3 and that the sales grow to 2 thousand dollars in the long run. a.Find the formula for unattained sales. b.Write an equation that shows the proportionality relation for G. c.On the basis of the equation from the part b, make a graph of G as a function of s. d.At what sales level is the growth rate as large as possible? e.What is the largest possible growth rate?arrow_forward
arrow_back_ios
arrow_forward_ios
Recommended textbooks for you
 Algebra and Trigonometry (MindTap Course List)AlgebraISBN:9781305071742Author:James Stewart, Lothar Redlin, Saleem WatsonPublisher:Cengage Learning
 College AlgebraAlgebraISBN:9781305115545Author:James Stewart, Lothar Redlin, Saleem WatsonPublisher:Cengage Learning
 Algebra & Trigonometry with Analytic GeometryAlgebraISBN:9781133382119Author:SwokowskiPublisher:Cengage
 Functions and Change: A Modeling Approach to Coll...AlgebraISBN:9781337111348Author:Bruce Crauder, Benny Evans, Alan NoellPublisher:Cengage Learning

Algebra and Trigonometry (MindTap Course List)
Algebra
ISBN:9781305071742
Author:James Stewart, Lothar Redlin, Saleem Watson
Publisher:Cengage Learning
College Algebra
Algebra
ISBN:9781305115545
Author:James Stewart, Lothar Redlin, Saleem Watson
Publisher:Cengage Learning
Algebra & Trigonometry with Analytic Geometry
Algebra
ISBN:9781133382119
Author:Swokowski
Publisher:Cengage
Functions and Change: A Modeling Approach to Coll...
Algebra
ISBN:9781337111348
Author:Bruce Crauder, Benny Evans, Alan Noell
Publisher:Cengage Learning
Finding Local Maxima and Minima by Differentiation; Author: Professor Dave Explains;https://www.youtube.com/watch?v=pvLj1s7SOtk;License: Standard YouTube License, CC-BY