
Modern Business Statistics with Microsoft Office Excel (with XLSTAT Education Edition Printed Access Card) (MindTap Course List)
6th Edition
ISBN: 9781337115186
Author: David R. Anderson, Dennis J. Sweeney, Thomas A. Williams, Jeffrey D. Camm, James J. Cochran
Publisher: Cengage Learning
expand_more
expand_more
format_list_bulleted
Videos
Textbook Question
Chapter 10.4, Problem 35E
In a test of the quality of two television commercials, each commercial was shown in a separate test area six times over a one-week period. The following week a telephone survey was conducted to identify individuals who had seen the commercials. Those individuals were asked to state the primary message in the commercials. The following results were recorded.
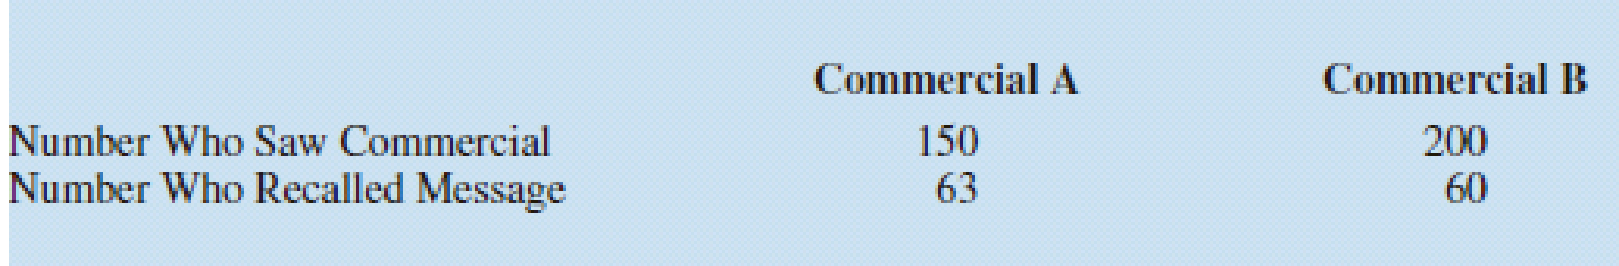
- a. Use α = .05 and test the hypothesis that there is no difference in the recall proportions for the two commercials.
- b. Compute a 95% confidence interval for the difference between the recall proportions for the two populations.
Expert Solution & Answer
Want to see the full answer?
Check out a sample textbook solution
Students have asked these similar questions
A U.S. Food Survey showed that Americans routinely eat beef in their diet. Suppose that in a study of 49 consumers in Illinois and 64 consumers in Texas the following results were obtained from two samples regarding average yearly beef consumption:
Illinois Texas
= 49 = 64
= 54.1lb = 60.4lb
S1 = 7.0 S2 = 8.0
Develop a 95% confidence Interval Estimate for the difference between the two population means.
In a study designed to assess the side effects of two drugs, 50 animals were given drug A, and 50 animals were given Drug B. Of the 50 receiving Drug A, 11 showed undesirable side effects, while 8 of those receiving Drug B reacted similarly. Find the 98% confidence interval for the true difference in population proportions, pˆ A − pˆ B.
Consider the following sample information randomly selected from two populations. Sample 1: n1 =250, X1=30
Sample 2: n2 =100, X2= 33
a.) Calculate a 95% confidence interval for the difference between the two population proportions.
Chapter 10 Solutions
Modern Business Statistics with Microsoft Office Excel (with XLSTAT Education Edition Printed Access Card) (MindTap Course List)
Ch. 10.1 - The following results come from two independent...Ch. 10.1 - 2. Consider the following hypothesis test.
The...Ch. 10.1 - 3. Consider the following hypothesis test.
The...Ch. 10.1 - 4. Condé Nast Traveler conducts an annual survey...Ch. 10.1 - 5. The USA Today reports that the average...Ch. 10.1 - Hotel Price Comparison. Suppose that you are...Ch. 10.1 - Consumer Reports uses a survey of readers to...Ch. 10.1 - Increases in Customer Satisfaction. Will improving...Ch. 10.2 - The following results are for independent random...Ch. 10.2 - Consider the following hypothesis test:
The...
Ch. 10.2 - Consider the following data for two independent...Ch. 10.2 - Prob. 12ECh. 10.2 - Annual Cost of College. The increasing annual cost...Ch. 10.2 - Are nursing salaries in Tampa, Florida, lower than...Ch. 10.2 - Hotel prices worldwide are projected to increase...Ch. 10.2 - Effect of Parents’ Education on Student SAT...Ch. 10.2 - Comparing Financial Consultant Ratings....Ch. 10.2 - Researchers at Purdue University and Wichita State...Ch. 10.3 - Consider the following hypothesis test.
The...Ch. 10.3 - The following data are from matched samples taken...Ch. 10.3 - Prob. 21ECh. 10.3 - The price per share of stock for a sample of 25...Ch. 10.3 - Credit Card Expenditures. Bank of America’s...Ch. 10.3 - Domestic Airfare. The Global Business Travel...Ch. 10.3 - Prob. 25ECh. 10.3 - PGA Tour Scores. Scores in the first and fourth...Ch. 10.3 - Price Comparison of Smoothie Blenders. A personal...Ch. 10.4 - Consider the following results for independent...Ch. 10.4 - Prob. 29ECh. 10.4 - Corporate Hiring Outlook. A Businessweek/Harris...Ch. 10.4 - Impact of Pinterest on Purchase Decisions. Forbes...Ch. 10.4 - Mislabeled Fish. Researchers with Oceana, a group...Ch. 10.4 - Minnesota had the highest turnout rate of any...Ch. 10.4 - Oil wells are expensive to drill, and dry wells...Ch. 10.4 - In a test of the quality of two television...Ch. 10.4 - Winter visitors are extremely important to the...Ch. 10.4 - Prob. 37ECh. 10 - Prob. 38SECh. 10 - SUV Lease Payments. Statista reports that the...Ch. 10 - Prob. 40SECh. 10 - Kitchen Versus Bedroom Remodeling Costs. The...Ch. 10 - Effect of Siblings on SAT Scores. In Born...Ch. 10 - Country Financial, a financial services company,...Ch. 10 - Prob. 44SECh. 10 - Prob. 45SECh. 10 - News Access Via Computer. The American Press...Ch. 10 - For the week ended January 15, 2009, the bullish...
Knowledge Booster


Learn more about
Need a deep-dive on the concept behind this application? Look no further. Learn more about this topic, statistics and related others by exploring similar questions and additional content below.Similar questions
- What is meant by the sample space of an experiment?arrow_forwardTo assess the effectiveness of a kindergarten-readiness program, 15 children from a random sample were each given a diagnostic assessment before beginning the program and a follow-up assessment after completing the program. For each child, the difference in the score points between the two assessments was calculated and used to create the 95 percent confidence interval (20.1,23.9)(20.1,23.9). Assuming all conditions for inference are met, which of the following is a correct interpretation of the interval? A) For all children in the program, 95 percent of the children will have a mean difference in scores of between 20.1 points and 23.9 points. B) There is a 0.95 probability that the mean difference in scores for all children in the sample is between 20.1 points and 23.9 points. C) There is a 0.95 probability that the mean difference in scores for the children in the program is between 20.1 points and 23.9 points. D) We are 95 percent confident that the mean difference in scores for…arrow_forwardIn an article in the Journal of Advertising, Weinberger and Spotts compare the use of humor in television ads in the United States and the United Kingdom. They found that a substantially greater percentage of U.K. ads use humor.a. Suppose that a random sample of 400 television ads in the United Kingdom reveals that 142 of these ads use humor. Find a point estimate of and a 95 percent confidence interval for the proportion of all U.K. television ads that use humor.b. Suppose a random sample of 500 television ads in the United States reveals that 122 of these ads use humor. Find a point estimate of and a 95 percent confidence interval for the proportion of all U.S. television ads that use humor.c. Do the confidence intervals you computed in parts a and b suggest that a greater percentage of U.K. ads use humor? Explain.arrow_forward
- The following sample information is given concerning the ACT scores of high school seniors from two local schools. School A School B n1=14 n2=15 x1=25 x2=23 Q12=16 Q22=10 Develop a 95% confidence interval estimate for the difference between two populations.arrow_forwardIn an experiment of normal body temperatures in degrees Fahrenheit, 6 males ages 25-40 were given a random temperature check. The results were as follows: 97.1 99.0 98.2 98.9 98.1 99.4 a. Construct and interpret a 95% Confidence Interval for the average normal body temperature of males ages 25-40. b. Construct and interpret a 95% Prediction Interval for the next temperature taken. c. The average normal body temperature is generally accepted as 98.6 °F. Given the above data, should scientists reconsider this general statement? Use ? = 0.05.arrow_forwardA researcher was interested in comparing the amount of time spent watching television by women and by men. Independent simple random samples of 14 women and 17 men were selected, and each person was asked how many hours he or she had watched television during the previous week. The summary statistics are as follows.women: x1=12.6 hrs, s1=3.9 hrs, n1=14.0 men : x2 = 14.0 hrs, s2= 5.2 hrs, n2= 17 Construct a 99% confidence interval for the difference between the mean amount of time spent watching television for women and the mean amount of time spent watching television for men.arrow_forward
- 1. A recent survey showed that from a sample of 500 packages delivered by a Postal Service, 480were delivered on time. a) Construct a 95% confidence interval for the proportion of all packages that are deliveredon time by the Postal Service.arrow_forwardIn a situation where the sample size was decreased from 39 to 29 in a normally distributed data set, what would be the impact on the confidence interval?arrow_forwardA random sample of students at a college shows that 54 of 200 students had part-time jobs. Which of the follow-ing is the correct formula for a 90% confidence interval for the proportion of all students at this college withpart-time jobs?A) 0.27 { 1.28B10.27210.732200B) 0.27 { 1.28B10.5210.52200C) 0.27 { 1.645B10.27210.732200D) 0.27 { 1.645B10.5210.52200E) 0.27 { 1.96B10.27210.732200arrow_forward
- During a laboratory analysis of human blood composition, tests are repeated and are known to be normally distributed. Fifteen tests on a given sample of blood yielded the following values 1.003 1.01 1.03 1.045 1.006 1.024 1.019 1.009 1.014 1.021 1.031 1.08 1.058 1.012 1.001 Calculate the 98% confidence interval for true composition of the blood in repeated tests of the sample.arrow_forwardIn a random sample of 850 consumers. 385 reported that they were able to purchase a Playstation 5. Which of the following is a 98% confidence interval for the population proportion of consumers that were able to purchase a Playstation 5? A) (0.4131, 0.4927) B)(0.4089, 0.4969) C)(0.4248, 0.4810) D) (0.4194, 0.4864)arrow_forwardThe following are airborne times (in minutes) for 10 randomly selected flights from San Francisco to Washington Dulles airport. 269 255 267 285 274 275 266 258 271 281 (a) Compute a 90% confidence interval for the mean airborne time for flights from San Francisco to Washington Dulles. (Round your answers to three decimal places.) , Interpret a 90% confidence interval for the mean airborne time for flights from San Francisco to Washington Dulles. There is a 90% chance that the true difference in the mean airborne time for flights from San Francisco to Washington Dulles is directly in the middle of these two values.We are 90% confident that the mean airborne time for flights from San Francisco to Washington Dulles is between these two values. There is a 90% chance that the true mean airborne time for flights from Washington Dulles to San Francisco is directly in the middle of these two values.We are 90% confident that the true mean airborne time for…arrow_forward
arrow_back_ios
SEE MORE QUESTIONS
arrow_forward_ios
Recommended textbooks for you
 College Algebra (MindTap Course List)AlgebraISBN:9781305652231Author:R. David Gustafson, Jeff HughesPublisher:Cengage Learning
 Glencoe Algebra 1, Student Edition, 9780079039897...AlgebraISBN:9780079039897Author:CarterPublisher:McGraw Hill
College Algebra (MindTap Course List)
Algebra
ISBN:9781305652231
Author:R. David Gustafson, Jeff Hughes
Publisher:Cengage Learning
Glencoe Algebra 1, Student Edition, 9780079039897...
Algebra
ISBN:9780079039897
Author:Carter
Publisher:McGraw Hill
Hypothesis Testing using Confidence Interval Approach; Author: BUM2413 Applied Statistics UMP;https://www.youtube.com/watch?v=Hq1l3e9pLyY;License: Standard YouTube License, CC-BY
Hypothesis Testing - Difference of Two Means - Student's -Distribution & Normal Distribution; Author: The Organic Chemistry Tutor;https://www.youtube.com/watch?v=UcZwyzwWU7o;License: Standard Youtube License