
Concept explainers
Videos
(a)
To determine the percentage of other spam: with the following information; types of e mail spam are classified into categories with respective percentages.
| Type of spam | Percent |
| Adult | 19 |
| Financial | 20 |
| Health | 7 |
| Internet | 7 |
| Leisure | 6 |
| Products | 25 |
| Scams | 9 |
| Other | ? |
(a)
Answer to Problem 10E
Percentage of other spam is 7%.
Explanation of Solution
The above information is listed in the following table.
| Type of spam | Percent |
| Adult | 19 |
| Financial | 20 |
| Health | 7 |
| Internet | 7 |
| Leisure | 6 |
| Products | 25 |
| Scams | 9 |
| Other | ? |
Since total percentage will add up to 100, the percentage of other spam is
100-19+20+7+7+6+25+9=100-93=7 .
Conclusion: Hence percentage of other spam is 7%.
(b)
To draw bar diagram: with the given data on proportion of spam and their type.
| Type of spam | Percent |
| Adult | 19 |
| Financial | 20 |
| Health | 7 |
| Internet | 7 |
| Leisure | 6 |
| Products | 25 |
| Scams | 9 |
| Other | ? |
(b)
Answer to Problem 10E
The following is bar chart.
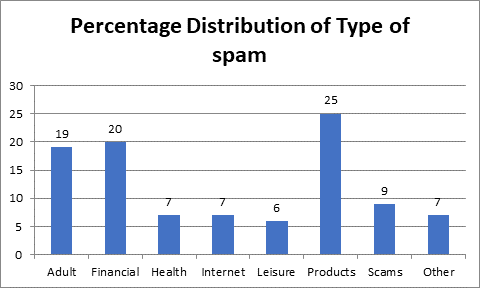
Explanation of Solution
The bar chart is drawn in excel by selecting the two columns of the above table.

whether pie chart can also be drawn.
Answer to Problem 10E
Pie chart can also be drawn.
Explanation of Solution
Pie chart is used when a phenomenon in broken in sub events and every
Chapter 1 Solutions
The Practice of Statistics for AP - 4th Edition
Additional Math Textbook Solutions
Introductory Statistics
Elementary Statistics Using Excel (6th Edition)
Statistics: The Art and Science of Learning from Data (4th Edition)
Introductory Statistics (10th Edition)
Intro Stats, Books a la Carte Edition (5th Edition)


 MATLAB: An Introduction with ApplicationsStatisticsISBN:9781119256830Author:Amos GilatPublisher:John Wiley & Sons Inc
 Probability and Statistics for Engineering and th...StatisticsISBN:9781305251809Author:Jay L. DevorePublisher:Cengage Learning
 Statistics for The Behavioral Sciences (MindTap C...StatisticsISBN:9781305504912Author:Frederick J Gravetter, Larry B. WallnauPublisher:Cengage Learning
 Elementary Statistics: Picturing the World (7th E...StatisticsISBN:9780134683416Author:Ron Larson, Betsy FarberPublisher:PEARSON
 The Basic Practice of StatisticsStatisticsISBN:9781319042578Author:David S. Moore, William I. Notz, Michael A. FlignerPublisher:W. H. Freeman
 Introduction to the Practice of StatisticsStatisticsISBN:9781319013387Author:David S. Moore, George P. McCabe, Bruce A. CraigPublisher:W. H. Freeman