Videos
Analyze and compare Amazon.com and Wal-Mart
Amazon.com, Inc. (AMZN) is one of the largest Internet retailers in (lie world. Wal-Mart Stores, Inc. (WMT) is the largest retailer in the United States. Amazon and Wal-Mart compete in similar markets; however, Wal-Mart sells through both traditional retail stores and the Internet, while Amazon sells only through the Internet. Interest expense and income before income tax expense from the financial statements of both companies for two recent years follow (in millions):
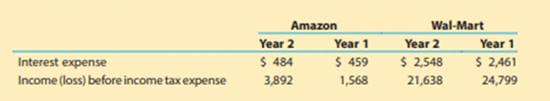
a. Compute the times interest earned ratio for both companies for the two years. Round to one decimal place.
b.  Interpret Amazon’s interest coverage from Year 1 to Year 2.
c. Does a times interest earned ratio less than 1.0 mean that creditors will not get paid interest?
d. Interpret Wal-Mart’s interest coverage from Year 1 to Year 2.
e. Which company appears to have the greater protection for creditors?

Trending nowThis is a popular solution!

Chapter 11 Solutions
Corporate Financial Accounting


- Conducting a Financial Ratio Analysis on HP INC. Use online resources to work on this chapter's questions. Please note that website information changes over time, and these changes may limit your ability to answer some of these questions. In Chapter 3, we looked at Dunkin' Brands' financial statements. In this chapter, we will use financial Internet websites (specifically, www.morningstar.com and www.google.com / finance) to analyze HP Inc., a computer hardware company. Once on either website, you simply enter HP Inc.'s ticker symbol (HPQ) to obtain the financial information needed. The text mentions that financial statement analysis has two major components: a trend analysis, where we evaluate changes in key ratios over time, and a freer analysis, where we compare financial ratios with firms that are in the same industry and/or line of business. We will do both of these types of analysis in this problem. Through the Morningstar website, you can find the firm's financials (Income Statement, Balance Sheet, and Cash Flow) on an annual or quarterly basis for the five most recent time periods. In addition, the site contains Key Ratios (Profitability, Growth, Cash Flow, Financial Health, and Efficiency) for 10 years. We will use the Key Ratios on this site to conduct the firm's trend analysis. (At the bottom of the screen you will see that you can click "Glossary to find definitions for the different ratios For example, Morningstar's Financial Leverage ratio is the same as the Equity multiplier that we use in the textbook.) On the Google Finance site, you can find the firms financial statements for the four most recent years or the five most recent quarters and key financial data for related companies for the most recent year or quarter. We will use the related companies' annual data to conduct the firm's peer analysis. Notice that when you go to the "Related Companies" screen, you can "add or remove columns." Click on that phrase, and you can check which peer data items you'd like to show on tire computer screen. Also, once you have chosen the data, you can click on a term, and the companies will be ranked in either ascending or descending order for tire specific term selected. 6. From the Google Finance site, look at HP's profitability ratios (as measured by its profit margin, ROA, and ROE). How do these ratios compare with those of its peers?arrow_forwardConducting a Financial Ratio Analysis on HP INC. Use online resources to work on this chapter's questions. Please note that website information changes over time, and these changes may limit your ability to answer some of these questions. In Chapter 3, we looked at Dunkin' Brands' financial statements. In this chapter, we will use financial Internet websites (specifically, www.morningstar.com and www.google.com/finance) to analyze HP Inc., a computer hardware company. Once on either website, you simply enter HP Inc.'s ticker symbol (HPQ) to obtain the financial information needed. The text mentions that financial statement analysis has two major components: a trend analysis, where we evaluate changes in key ratios over time, and a freer analysis, where we compare financial ratios with firms that are in the same industry and/or line of business. We will do both of these types of analysis in this problem. Through the Morningstar website, you can find the firm's financials (Income Statement, Balance Sheet, and Cash Flow) on an annual or quarterly basis for the five most recent time periods. In addition, the site contains Key Ratios (Profitability, Growth, Cash Flow, Financial Health, and Efficiency) for 10 years. We will use the Key Ratios on this site to conduct the firm's trend analysis. (At the bottom of the screen you will see that you can click "Glossary" to find definitions for the different ratios. For example, Morningstar's Financial Leverage ratio is the same as the Equity multiplier that we use in the textbook.) On the Google Finance site, you can find the firms financial statements for the four most recent years or the five most recent quarters and key financial data for related companies for the most recent year or quarter. We will use the related companies' annual data to conduct the firm's peer analysis. Notice that when you go to the "Related Companies" screen, you can "add or remove columns." Click on that phrase, and you can check which peer data items you'd like to show on tire computer screen. Also, once you have chosen the data, you can click on a term, and the companies will be ranked in either ascending or descending order for the specific term selected. 1. Looking at Morningstar's Financial Health ratios, what has happened to HPs liquidity position over the past 10 years?arrow_forwardConducting a Financial Ratio Analysis on HP INC. Use online resources to work on this chapter's questions. Please note that website information changes over time, and these changes may limit your ability to answer some of these questions. In Chapter 3, we looked at Dunkin' Brands' financial statements. In this chapter, we will use financial Internet websites (specifically, www.morningstar.com and wnvcv.google.com/finance) to analyze HP Inc., a computer hardware company. Once on either website, you simply enter HP Inc.'s ticker symbol (HPQ) to obtain the financial information needed. The text mentions that financial statement analysis has two major components: a trend analysis, where we evaluate changes in key ratios over time, and a peer analysis, where we compare financial ratios with firms that are in the same industry and/or line of business. We will do both of these types of analysis in this problem. Through the Morningstar website, you can find the firm's financials (Income Statement, Balance Sheet, and Cash Flow) on an annual or quarterly basis for the five most recent time periods. In addition, the site contains Key Ratios (Profitability, Growth, Cash Flow, Financial Health, and Efficiency) for 10 years. We will use the Key Ratios on this site to conduct the firm's trend analysis. (At the bottom of the screen you will see that you can click "Glossary to find definitions for the different ratios For example, Morningstar's Financial Leverage ratio is the same as the Equity multiplier that we use in the textbook.) On the Google Finance site, you can find the firms financial statements for the four most recent years or the five most recent quarters and key financial data for related companies for the most recent year or quarter. We will use the related companies' annual data to conduct the firms peer analysis. Notice that when you go to the "Related Companies" screen, you can add or remove columns. Click on that phrase, and you can check which peer data items you'd like to show on tire computer screen. Also, once you have chosen the data, you can click on a term, and the companies will be ranked in either ascending or descending order for the specific term selected. 7. From the Google Finance site, use the DuPont analysis to determine the total assets turnover ratio for each of tire peer companies. (Hint ROA = Profit margin Total assets turnover.) Once you've calculated each peer 's total assets turnover ratio, then you can use the DuPont analysis to calculate each peer's equity multiplier.arrow_forward
- Conducting a Financial Ratio Analysis on HP INC. Use online resources to work on this chapter's questions. Please note that website information changes over time, and these changes may limit your ability to answer some of these questions. In Chapter 3, we looked at Dunkin' Brands' financial statements. In this chapter, we will use financial Internet websites (specifically, www.morningstar.com and www.google.com/finance) to analyze HP Inc., a computer hardware company. Once on either website, you simply enter HP Inc.'s ticker symbol (HPQ) to obtain the financial information needed. The text mentions that financial statement analysis has two major components: a trend analysis, where we evaluate changes in key ratios over time, and a freer analysis, where we compare financial ratios with firms that are in the same industry and/or line of business. We will do both of these types of analysis in this problem. Through the Morningstar website, you can find the firm's financials (Income Statement, Balance Sheet, and Cash Flow) on an annual or quarterly basis for the five most recent time periods. In addition, the site contains Key Ratios (Profitability', Growth, Cash Flow, Financial Health, and Efficiency) for 10 years. We will use the Key Ratios on this site to conduct the firm's trend analysis. (At the bottom of the screen you will see that you can click "Glossary to find definitions for the different ratios. For example, Morningstar's Financial Leverage ratio is the same as the Equity multiplier that we use in the textbook.) On the Google Finance site, you can find the firm's financial statements for the four most recent years or the five most recent quarters and key financial data for related companies for the most recent year or quarter. We will use the related companies' annual data to conduct the firm's peer analysis. Notice that when you go to the "Related Companies" screen, you can "add or remove columns, Click on that phrase, and you can check which peer data items you'd like to show on tire computer screen. Also, once you have chosen the data, you can click on a term, and the companies will be ranked in either ascending or descending order for tire specific term selected. 8. From tire information gained in question 7 and using the DuPont analysis, what are HP's strengths and weaknesses compared to those of its competitors?arrow_forwardAnalyze and compare Hilton and Marriott Hilton Worldwide Holdings, Inc. (HLT) and Marriott International, Inc. (MAR) are two of the largest hotel operators in the world. Selected financial information from recent income statements for both companies follows (in millions): a. Compute the times interest earned ratio for each company. Round to one decimal place. b. Which company appears to better protect creditor interest? Why?arrow_forwardAnalyze and compare Kroger and Tiffany The Kroger Company (KR), a national supermarket chain, reported the following data (in millions) in its financial statements for a recent year: a.Compute the asset turnover ratio. Round to two decimal places. b.Tiffany Co. (TIF) is a large North American retailer of jewelry. Tiffanys asset turnover ratio is 0.78. Why would Tiffanys asset turnover ratio be lower than that of Kroger?arrow_forward
- Codification Situation You are conducting an accounting research project for your boss. Your boss has asked you to determine the appropriate U.S. GAAP that specifies how your company should recognize revenues from the sales of products in a retail store. Your boss is confused because most customers pay cash, but some customers purchase on credit terms, and pay in cash 30 days later. Your manager also wants you to determine the GAAP guidance for how revenue should be recognized in income. Your manager has a lot of knowledge and experience in accounting and has heard about, but has never used, the FASB Accounting Standards Codification system. Directions Use the FASB Accounting Standards Codification system to conduct the research your manager has assigned to you. Use the Codification to determine how to recognize revenue from retail sales, including the right to return. Be prepared to show your manager the specific FASB ASC references that provide the appropriate guidance. Also prepare a brief memo explaining to your manager the different levels of the Codification and how to use the Codification system.arrow_forwardContinuing Company AnalysisAmazon: Accounts receivable turnover and number of days sales in receivables Amazon.com, Inc. is one of the largest Internet retailers in the world. Best Buy, Inc. is a leading retailer of consumer electronics and media products in the United States. Amazon and Best Buy compete in similar markets; however, Best Buy sells through both traditional retail stores and the Internet, while Amazon sells only through the Internet. Sales and accounts receivable information for both companies for a recent period follows (in millions): Amazon Best Buy Sales 88,988 40,339 Accounts receivable: Beginning of year 4,767 1,308 End of year 5,612 1,280 A. Determine the accounts receivable turnover for each company. (Round all calculations to one decimal place.) B. Determine the number of days sales in receivables for each company. (Round all calculations to one decimal place.) C. Evaluate the relative efficiency in collecting accounts receivables between the two companies. D. What might explain this difference?arrow_forwardConducting a Financial Ratio Analysis on HP INC. Use online resources to work on this chapter's questions. Please note that website information changes over time, and these changes may limit your ability to answer some of these questions. In Chapter 3, we looked at Dunkin' Brands' financial statements. In this chapter, we will use financial Internet websites (specifically, www.morningstar.com and www.google.com/finance) to analyze HP Inc., a computer hardware company. Once on either website, you simply enter HP Inc.'s ticker symbol (HPQ) to obtain the financial information needed. The text mentions that financial statement analysis has two major components: a trend analysis, where we evaluate changes in key ratios over time, and a freer analysis, where we compare financial ratios with firms that are in the same industry and/or line of business. We will do both of these types of analysis in this problem. Through the Morningstar website, you can find the firm's financials (Income Statement, Balance Sheet, and Cash Flow) on an annual or quarterly basis for the five most recent time periods. In addition, the site contains Key Ratios (Profitability, Growth, Cash Flow, Financial Health, and Efficiency) for 10 years. We will use the Key Ratios on this site to conduct the firm's trend analysis. (At the bottom of the screen you will see that you can click "Glossary" to find definitions for the different ratios. For example, Morningstar's Financial Leverage ratio is the same as the Equity multiplier that we use in the textbook.) On the Google Finance site, you can find the firms financial statements for the four most recent years or the five most recent quarters and key financial data for related companies for the most recent year or quarter. We will use the related companies' annual data to conduct the firm's peer analysis. Notice that when you go to the "Related Companies" screen, you can "add or remove columns." Click on that phrase, and you can check which peer data items you'd like to show on tire computer screen. Also, once you have chosen the data, you can click on a term, and the companies will be ranked in either ascending or descending order for tire specific term selected. 2. Looking at Morningstar's Financial Health ratios, what has happened to HP's financial leverage position over tire past 10 years?arrow_forward
- Conducting a Financial Ratio Analysis on HP INC. Use online resources to work on this chapter's questions. Please note that website information changes over time, and these changes may limit your ability to answer some of these questions. In Chapter 3, we looked at Dunkin' Brands' financial statements. In this chapter, we will use financial Internet websites (specifically, www.morningstar.com and www.google.com/finance) to analyze HP Inc., a computer hardware company. Once on either website, you simply enter HP Inc.'s ticker symbol (HPQ) to obtain the financial information needed. The text mentions that financial statement analysis has two major components: a trend analysis, where we evaluate changes in key ratios over time, and a peer analysis, where we compare financial ratios with firms that are in the same industry and/or line of business. We will do both of these types of analysis in this problem. Through the Morningstar website, you can find the firm's financials (Income Statement, Balance Sheet, and Cash Flow) on an annual or quarterly basis for the five most recent time periods. In addition, the site contains Key Ratios (Profitability, Growth, Cash Flow, Financial Health, and Efficiency) for 10 years. We will use the Key Ratios on this site to conduct the firm's trend analysis. (At the bottom of the screen you will see that you can click "Glossary" to find definitions for the different ratios. For example, Morningstar's Financial Leverage ratio is the same as the Equity multiplier that we use in the textbook.) On the Google Finance site, you can find the firms financial statements for the four most recent years or the five most recent quarters and key financial data for related companies for the most recent year or quarter. We will use the related companies' annual data to conduct the firm's peer analysis. Notice that when you go to the "Related Companies" screen, you can "add or remove columns." Click on that phrase, and you can check which peer data items you'd like to show on tire computer screen. Also, once you have chosen the data, you can click on a term, and the companies will be ranked in either ascending or descending order for tire specific term selected. 5. From the Google Finance site, look at HP's liquidity position (as measured by its current ratio). How does this ratio compare with those of its peers?arrow_forwardConducting a Financial Ratio Analysis on HP INC. Use online resources to work on this chapter's questions. Please note that website information changes over time, and these changes may limit your ability to answer some of these questions. In Chapter 3, we looked at Dunkin' Brands' financial statements. In this chapter, we will use financial Internet websites (specifically, www.morningstar.com and www.google.com / finance) to analyze HP Inc., a computer hardware company. Once on either website, you simply enter HP Inc.'s ticker symbol (HPQ) to obtain the financial information needed. The text mentions that financial statement analysis has two major components: a trend analysis, where we evaluate changes in key ratios over time, and a peer analysis, where we compare financial ratios with firms that are in the same industry and/or line of business. We will do both of these types of analysis in this problem. Through the Morningstar website, you can find the firm's financials (Income Statement, Balance Sheet, and Cash Flow) on an annual or quarterly basis for the five most recent time periods. In addition, the site contains Key Ratios (Profitability, Growth, Cash Flow, Financial Health, and Efficiency) for 10 years. We will use the Key Ratios on this site to conduct the firm's trend analysis. (At the bottom of the screen you will see that you can click "Glossary" to find definitions for the different ratios. For example, Morningstar's Financial Leverage ratio is the same as the Equity multiplier that we use in the textbook.) On the Google Finance site, you can find the firms financial statements for the four most recent years or the five most recent quarters and key financial data for related companies for the most recent year or quarter. We will use the related companies' annual data to conduct the firm's peer analysis. Notice that when you go to the "Related Companies" screen, you can "add or remove columns." Click on that phrase, and you can check which peer data items you'd like to show on tire computer screen. Also, once you have chosen the data, you can click on a term, and the companies will be ranked in either ascending or descending order for the specific term selected. 4. Identify Google Finance's list of related companies to HP. Which is the largest in terms of market capitalization? Which is the smallest? Where does HT rank (in terms of market capitalization)?arrow_forwardRatio of Liabilities to Stockholders’ Equity CompareAmazon.com to Best Buy Obj.6 Amazon.com, Inc. (AMZN) is one of the largest Internet retailers in the world. We will use Amazon as a continuing company exercise to reinforce the various tools and techniques for analyzing financial statements. We will begin with the ratio of liabilities to stockholders’ equity. Ratios can be used to compare companies in the same industry. For Amazon, there are a number of competitors that sell media, electronic, and other merchandise. Best Buy, Inc. (BBY) is one such company. The following total liabilities and stockholders’ equity information (in millions) is provided for Amazon and Best Buy for the end of a recent year:Amazon Best BuyTotal assets $64,747 $13,519Total liabilities 51,363 9,141Total stockholders' equity 13,384 4,378a. Compute the ratio of liabilities to stockholders' equity for each company. Round to two decimal places.b. What conclusions regarding the margin of protection to creditors…arrow_forward
 Financial And Managerial AccountingAccountingISBN:9781337902663Author:WARREN, Carl S.Publisher:Cengage Learning,
 Corporate Financial AccountingAccountingISBN:9781305653535Author:Carl Warren, James M. Reeve, Jonathan DuchacPublisher:Cengage Learning
 Financial & Managerial AccountingAccountingISBN:9781337119207Author:Carl Warren, James M. Reeve, Jonathan DuchacPublisher:Cengage Learning
 Intermediate Accounting: Reporting And AnalysisAccountingISBN:9781337788281Author:James M. Wahlen, Jefferson P. Jones, Donald PagachPublisher:Cengage Learning
 Survey of Accounting (Accounting I)AccountingISBN:9781305961883Author:Carl WarrenPublisher:Cengage Learning