
Concept explainers
Videos
(a)
To find: Percentage of vehicles that would fall in other category given the relative frequency distribution of vehicles by colours sold worldwide,
| Color | Percentage of Vehicles |
| Black | 19 |
| Blue | 6 |
| Brown /beige | 5 |
| Gray | 12 |
| Green | 1 |
| Red | 9 |
| Silver | 14 |
| White | 29 |
| Yellow/gold | 3 |
| Other | ?? |
The percentage of other vehicles is 2%.
Given the relative frequency distribution of vehicles by colours sold worldwide,
| Color | Percentage of Vehicles |
| Black | 19 |
| Blue | 6 |
| Brown beige | 5 |
| Gray | 12 |
| Green | 1 |
| Red | 9 |
| Silver | 14 |
| White | 29 |
| Yellow/gold | 3 |
| Other | ?? |
The percentage of other vehicles is equal to 100- sum of percentage of vehicles of listed colours since total frequency should add up to 100.
That is percentage of other vehicles
=100-19+6+5+12+1+9+14+29+3
=100-98
=2
Hence the percentage of other vehicles is2%.
(b)
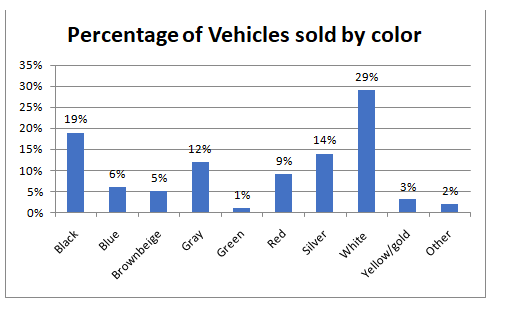
To draw: a bar chart with the following information.
| Color | Percentage of Vehicles |
| Black | 19 |
| Blue | 6 |
| Brown /beige | 5 |
| Gray | 12 |
| Green | 1 |
| Red | 9 |
| Silver | 14 |
| White | 29 |
| Yellow/gold | 3 |
| Other | ?? |
The bar chart is given below. Data reveals that maximum people have passion for white colour since highest percentage of cars bought is white ( 29%) followed by black ( 19%) and then silver (14%) as per data description given in question. The least favoured colour is Green ( 1%).
The two columns of the data are entered as decimals after dividing by 100. These are formatted as percentages and a column chart is plotted.
Conclusion: Data reveals that maximum people have passion for white colour since highest percentage of cars bought is white ( 29%) followed by black ( 19%) and then silver (14%) as per data description given in question. The least favoured colour is Green ( 1%).
(c)
To determine: whether pie chart can be drawn.
Yes. Pie chart can be drawn.
Pie chart can be drawn as the data represent the whole phenomenon. That is percentage of total vehicles sold is broken by colour and percentage adds to 100.
Chapter 1 Solutions
PRACTICE OF STATISTICS F/AP EXAM
Additional Math Textbook Solutions
Statistics for Business and Economics (13th Edition)
Introductory Statistics (10th Edition)
Elementary Statistics Using Excel (6th Edition)
Introductory Statistics (2nd Edition)
Fundamentals of Statistics (5th Edition)


 MATLAB: An Introduction with ApplicationsStatisticsISBN:9781119256830Author:Amos GilatPublisher:John Wiley & Sons Inc
 Probability and Statistics for Engineering and th...StatisticsISBN:9781305251809Author:Jay L. DevorePublisher:Cengage Learning
 Statistics for The Behavioral Sciences (MindTap C...StatisticsISBN:9781305504912Author:Frederick J Gravetter, Larry B. WallnauPublisher:Cengage Learning
 Elementary Statistics: Picturing the World (7th E...StatisticsISBN:9780134683416Author:Ron Larson, Betsy FarberPublisher:PEARSON
 The Basic Practice of StatisticsStatisticsISBN:9781319042578Author:David S. Moore, William I. Notz, Michael A. FlignerPublisher:W. H. Freeman
 Introduction to the Practice of StatisticsStatisticsISBN:9781319013387Author:David S. Moore, George P. McCabe, Bruce A. CraigPublisher:W. H. Freeman