
Concept explainers
Videos
(a)
To display: the given data in a bar graph
(a)
Answer to Problem 16E
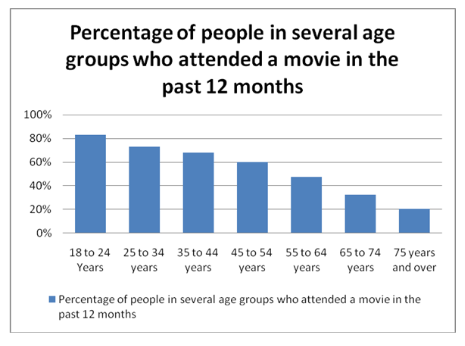
The height of the bar shows the category count or percentage.
The bar graph of the given data is below.
Explanation of Solution
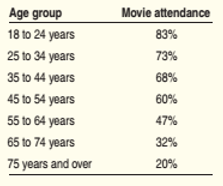
Given:
Calculation:
Bar graph is used to display the distribution of a categorical variable more vividly. It represents each category as a bar. The height of the bar shows the category count or percentage. The bar graph of the given data is below:

By looking at the bar graph we observe that the percentage of people which attend a movie in the past 12 months is decreasing as the age is increasing. We inference that the interest in movies diminishes as the age increases.
Conclusion:
Therefore,older people seems to go the movies less than the younger people.
(b)
To explain: whether it is correct to make a pie chart of the given data.
(b)
Answer to Problem 16E
It would not be correct to make pie chart of these data.
Explanation of Solution
Calculation:
Pie chart is used to display the distribution of categorical variables as a “pie” whose slices are sized by the counts or percent for the categories. A pie chart must include all the categories that make up a whole which is not the case in the given data. Also each percentage in the table refers to a different age group, not to parts of a single whole thus it would not be correct to make pie chart of these data.
Conclusion:
Therefore, it would not be correct to make pie chart of these data.
(c)
To explain: why the given data do not answer for the percent of the total audience having18 to 24 years old are watching movies.
(c)
Answer to Problem 16E
It is not possible to calculate the total number of audience for movies is 18 to 24 years old.
Explanation of Solution
Calculation:
The data does not answer the question if a movie studio wants to know what percent of total audience for movies is 18 to 24 years old because each percentage in the table refers to a different age group, not to parts of a single whole. It is not possible to calculate the total number of audience for movie is 18 to 24 years as it gives the percentage pertaining to that age group not the percentage of total audience as a whole.
Conclusion:
Therefore, it is not possible to calculate the total number of audience for movies is 18 to 24 years old.
Chapter 1 Solutions
The Practice of Statistics for AP - 4th Edition
Additional Math Textbook Solutions
Essentials of Statistics (6th Edition)
An Introduction to Mathematical Statistics and Its Applications (6th Edition)
Essentials of Statistics, Books a la Carte Edition (5th Edition)
Elementary Statistics: Picturing the World (7th Edition)
Elementary Statistics
Introductory Statistics


 MATLAB: An Introduction with ApplicationsStatisticsISBN:9781119256830Author:Amos GilatPublisher:John Wiley & Sons Inc
 Probability and Statistics for Engineering and th...StatisticsISBN:9781305251809Author:Jay L. DevorePublisher:Cengage Learning
 Statistics for The Behavioral Sciences (MindTap C...StatisticsISBN:9781305504912Author:Frederick J Gravetter, Larry B. WallnauPublisher:Cengage Learning
 Elementary Statistics: Picturing the World (7th E...StatisticsISBN:9780134683416Author:Ron Larson, Betsy FarberPublisher:PEARSON
 The Basic Practice of StatisticsStatisticsISBN:9781319042578Author:David S. Moore, William I. Notz, Michael A. FlignerPublisher:W. H. Freeman
 Introduction to the Practice of StatisticsStatisticsISBN:9781319013387Author:David S. Moore, George P. McCabe, Bruce A. CraigPublisher:W. H. Freeman