
Videos
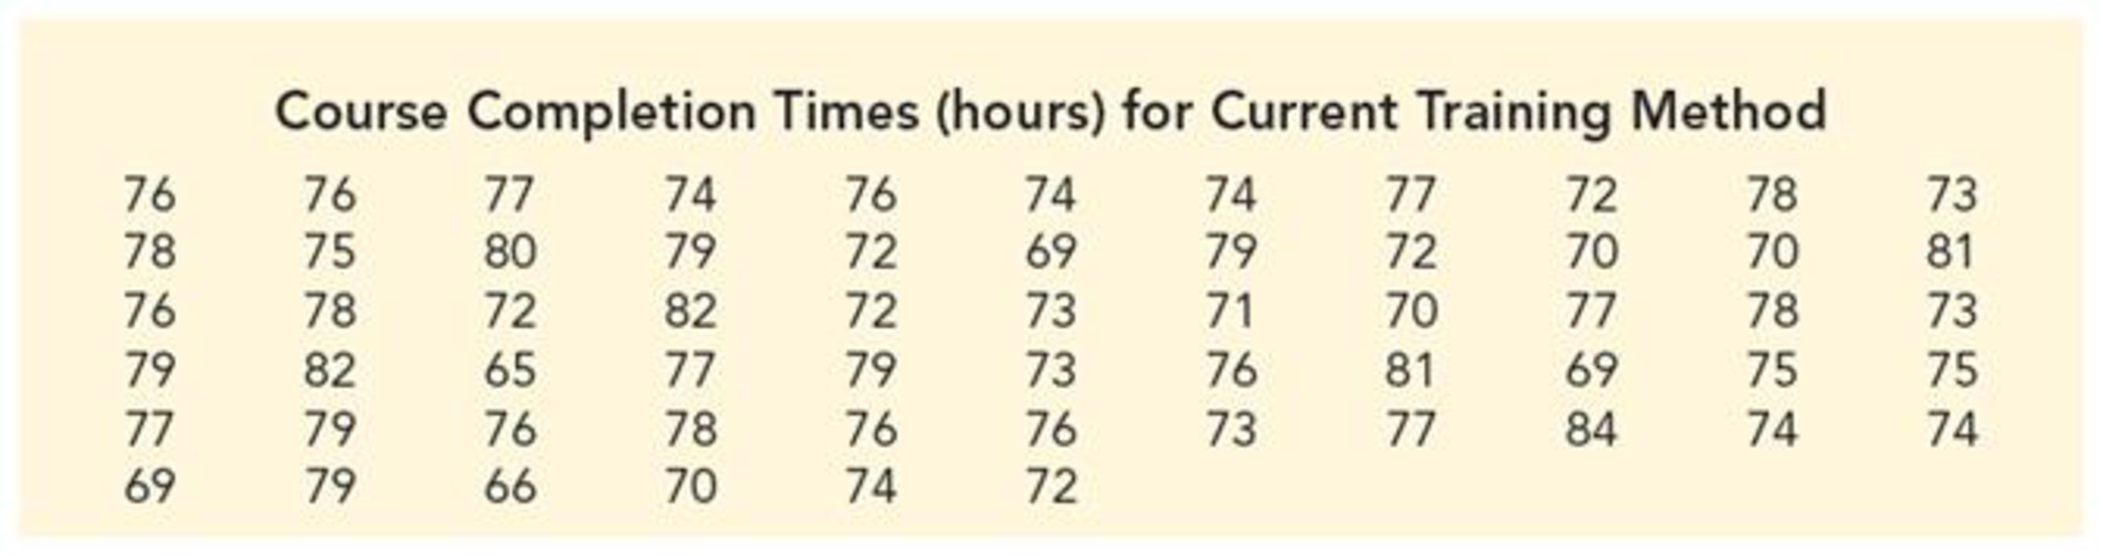
An Air Force introductory course in electronics uses a personalized system of instruction whereby each student views a videotaped lecture and then is given a programmed instruction text. The students work independently with the text until they have completed the training and passed a test. Of concern is the varying pace at which the students complete this portion of their training program. Some students are able to cover the programmed instruction text relatively quickly, whereas other students work much longer with the text and require additional time to complete the course. The fast students wait until the slow students complete the introductory course before the entire group proceeds together with other aspects of their training.
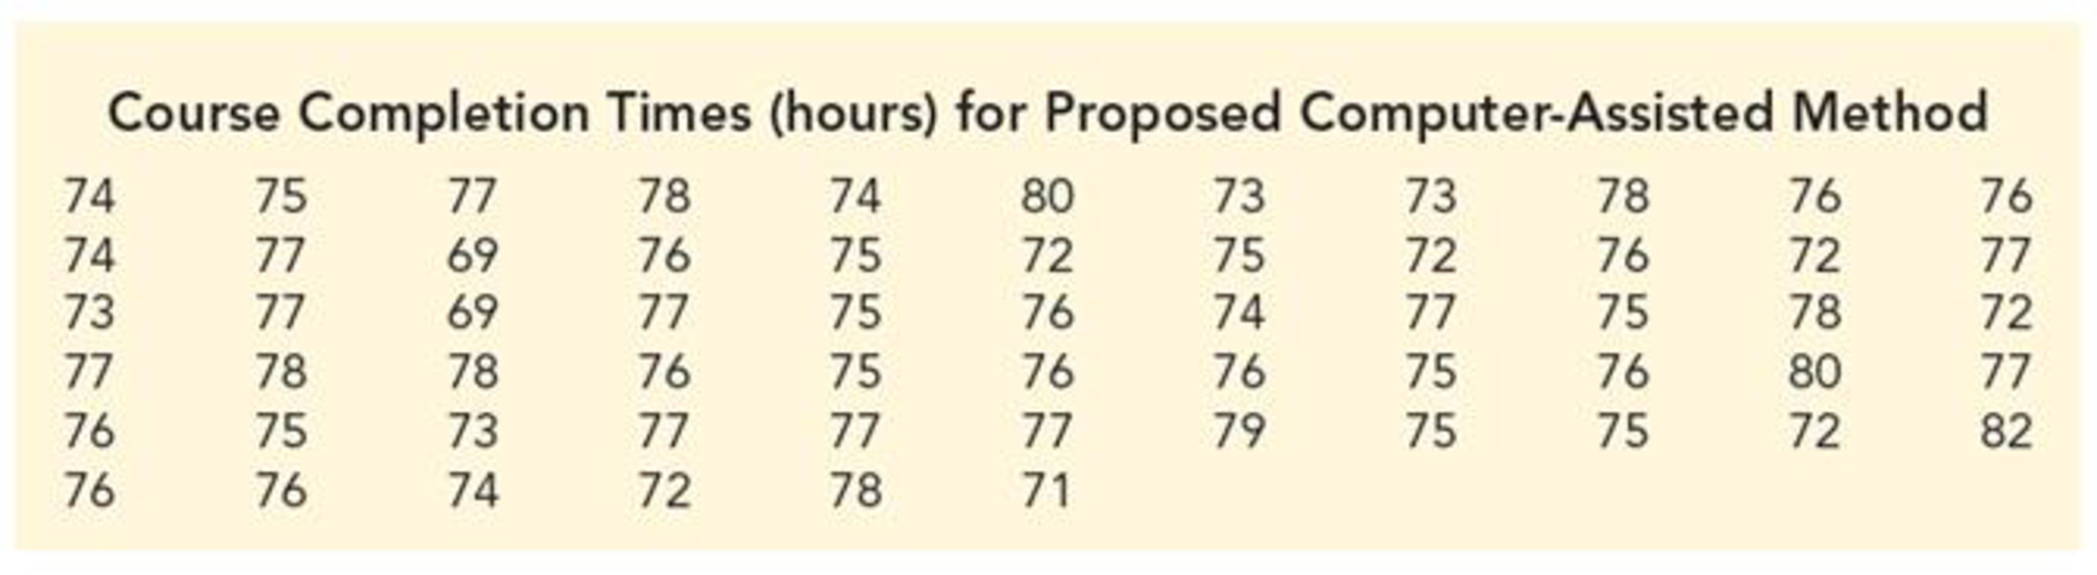
A proposed alternative system involves use of computer-assisted instruction. In this method, all students view the same videotaped lecture and then each is assigned to a computer terminal for further instruction. The computer guides the student, working independently, through the self-training portion of the course.
To compare the proposed and current methods of instruction, an entering class of 122 students was assigned randomly to one of the two methods. One group of 61 students used the current programmed-text method and the other group of 61 students used the proposed computer-assisted method. The time in hours was recorded for each student in the study. The following data are provided in the data set Training.
Managerial Report
- 1. Use appropriate
descriptive statistics to summarize the training time data for each method. What similarities or differences do you observe from the sample data? - 2. Conduct a hypothesis test on the difference between the population means for the two methods. Discuss your findings.
- 3. Compute the standard deviation and variance for each training method. Conduct a hypothesis test about the equality of population variances for the two training methods. Discuss your findings.
- 4. What conclusion can you reach about any differences between the two methods? What is your recommendation? Explain.
- 5. Can you suggest other data or testing that might be desirable before making a final decision on the training program to be used in the future?

Trending nowThis is a popular solution!

Chapter 11 Solutions
Essentials Of Statistics For Business & Economics


 College Algebra (MindTap Course List)AlgebraISBN:9781305652231Author:R. David Gustafson, Jeff HughesPublisher:Cengage Learning
 Algebra for College StudentsAlgebraISBN:9781285195780Author:Jerome E. Kaufmann, Karen L. SchwittersPublisher:Cengage Learning