
Videos
In Exercises 17–20, refer to the sample of body temperatures (degrees Fahrenheit) in table below. (The body temperatures are from a data set in Appendix B.)
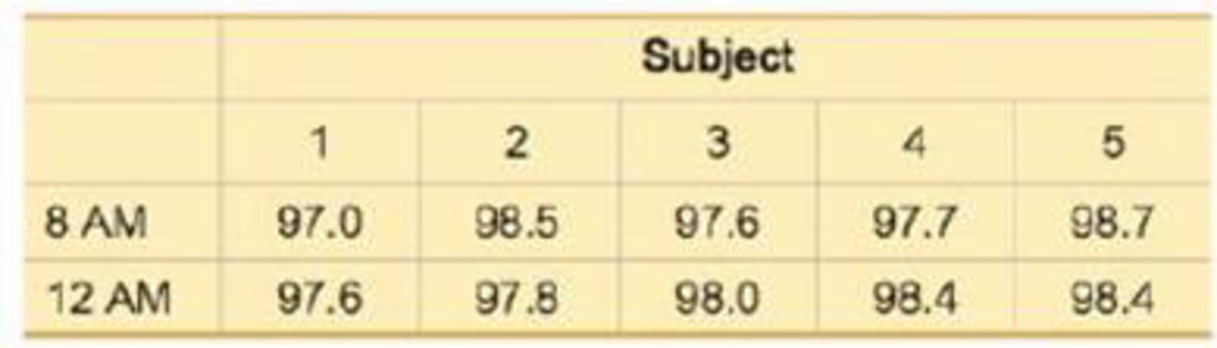
20. Conclusion If we analyze the listed body temperatures with suitable methods of statistics, we conclude that when the differences are found between the 8 AM body temperatures and the 12 AM body temperatures, there is a 64% chance that the differences can be explained by random results obtained from populations that have the same 8 AM and 12 AM body temperatures. What should we conclude about the statistical significance of those differences?
Want to see the full answer?
Check out a sample textbook solution
Chapter 1 Solutions
MYSTATLAB W/IR WORKSHEETS
Additional Math Textbook Solutions
Research Methods for the Behavioral Sciences (MindTap Course List)
Statistical Reasoning for Everyday Life (5th Edition)
Applied Statistics in Business and Economics
Intro Stats, Books a la Carte Edition (5th Edition)
Business Statistics: A First Course (8th Edition)


 MATLAB: An Introduction with ApplicationsStatisticsISBN:9781119256830Author:Amos GilatPublisher:John Wiley & Sons Inc
 Probability and Statistics for Engineering and th...StatisticsISBN:9781305251809Author:Jay L. DevorePublisher:Cengage Learning
 Statistics for The Behavioral Sciences (MindTap C...StatisticsISBN:9781305504912Author:Frederick J Gravetter, Larry B. WallnauPublisher:Cengage Learning
 Elementary Statistics: Picturing the World (7th E...StatisticsISBN:9780134683416Author:Ron Larson, Betsy FarberPublisher:PEARSON
 The Basic Practice of StatisticsStatisticsISBN:9781319042578Author:David S. Moore, William I. Notz, Michael A. FlignerPublisher:W. H. Freeman
 Introduction to the Practice of StatisticsStatisticsISBN:9781319013387Author:David S. Moore, George P. McCabe, Bruce A. CraigPublisher:W. H. Freeman