3. 5. 6. ty = f(x) (2, 8) y fy= f(x) 4. f(1.5. 5) 5 %3D 6- y = g(x) (-2, 8) 3 (-2, 0) (2, 0) -3 3 (-1, 0) (4, 0) (-3, –12) (1, -3) -3 (3,-12) -4 -2 2 (1, 2) -12- y = f(x) 4 x -5 y = g(x) -4 y = g(x) (a) f(x) > 0 (b) f(x) s 0 (a) g(x) < 0 (b) g (x) 2 0 (a) g(x) = f(x) (b) f(x) > g(x) (a) f(x) < g(x) (b) f(x) = g(x)
Q: 1. Suppose that the following data were collected on emphysema patients: The number of years the…
A: Given data, Years smoking x Lung damage y 25 55 36 60 22 50 15 30…
Q: In a population with o = 6, a score of X = 48 corresponds to z = 1.25. The mean for this population…
A: From the provided information, Standard deviation (σ) = 6 Z value = 1.25 And X = 48
Q: Find [E(x-x)] from the following table: 2 3 4 5 P(x) 0.1 0.1 0.2 0.3 0.2 0.1
A: Given The given table is Apply formula Ex=∑xxfxEx2=∑xx2fx
Q: A random sample of n1 = 14 winter days in Denver gave a sample mean pollution index x1 = 43.…
A: We have given that Sample sizes n1=14 , n2= 10 Sample means xbar1=43, xbar2=35 And standard…
Q: Suppose that an item has a hazard rate function X(t) = 2.4t², t> 0. What is the probability that (a)…
A:
Q: Find [E(x-x)] from the following table: 3 4 5 P(x) 0.1 0.1 0.2 0.3 0.2 0.1
A:
Q: 3.Suppose that you are interested in finding proportion of males that order cold brew at Starbucks.…
A: Given, The sample proportion is,
Q: The following plot shows the average estimates for 100 regressors (represented along the horizontal…
A: Plot of OLS: From the given average estimates for 100 regressor plot of 'OLS', we see that the…
Q: Suppose f(x) = 0.125x for 0 < x < 4. determine the mean and variance of X. Round your answers to 3…
A:
Q: The result below gives the amount (mg/mL) of ephedrine hydrochloride found in pharmaceutical…
A:
Q: 14) Data collected during an experiment are shown in the accompanying graph. 100- 75 50 25 o+ 1 23…
A: Range is the set of all output values of the function for which the function is defined.
Q: 2. An independent research group is interested to show that the percentage of babies deliver through…
A: Question 2: Claim: The percent of births by Cesarian section has decreased. Null Hypothesis: H0:…
Q: In order to study the effects of World War II on a certain country's economy, an economist used data…
A: According to question given :Lorenz curves for the distribution of income in 1935 and 1947.f(x)=x2.9…
Q: Suppose that h(x) is the hazard function of X, and h(x)=?λ for all x. (a) Calculate the survival…
A: Given: H(x) is the hazard function of X and h(x)=€,a constant
Q: If Xit is correlated with Xis for different values of s and t, then: O a. Xit is said to be ii.d. O…
A: We have to find out the effect of correlation between independent variables.
Q: At a certain university, 22% of students fail general chemistry on their first attempt. Professor…
A:
Q: The data for the height of women is approximately bell-shaped. If a woman’s height has a z-score of…
A: Given that Z-score is -1.3
Q: Compute the average rate of change of 16 - 7t on the following interval: [ − 2 , 2 2 ] SHOW ON…
A:
Q: A researcher reports an F-ratio with df(between) = 3 and df(within) = 28. How many treatment…
A: Note: Hey there! Thank you for the question. As you have posted multiple questions, we have helped…
Q: he following data calculate the groSs and net roproduction rates of females. Can you also calculate…
A:
Q: typical results show a mean self-esteem score of m=39 with ss=60.2 for a sample of n=10 male…
A: Given:
Q: .2. From heights (x;) in inches, weights (x2) in kg. and ages (x) in years of a group of students,…
A: The cause and effect relationship between the variables are estimated using the regression model. If…
Q: 4. From the following figures calculate the female gross reproduction rate if the ratio of male and…
A:
Q: A researcher wishes to try three different techniques to lower the blood pressure of individuals…
A:
Q: The following is a partial table of values for the number of Therms that Nancy used last month. If…
A:
Q: (1) Let X = b(16,) find E(4-3x) and distribution function.
A: From the provided information, X~b (16, 1/4) Sample size (n) = 16 Probability (p) = 1/4
Q: You have received a radioactive mass that is claimed to have a mean decay rate of at least 1…
A: Hey there! Thank you for posting the question. Since your question has more than 3 parts, we are…
Q: The residual is the difference between the _________ and the ___________. A. predicted value of y;…
A: In statistical models, a residual is the difference between the observed value (y) and the mean…
Q: When the level of investment expenditures of non-manufacturing firms in the US (denoted as Y), from…
A: Solution is given below:
Q: Let ~ U(0, 1). Show that X =-2ln(Y) follows an Exponential distribution with mean 2.
A: Given that Y follows Uniform(0,1) And X = -2ln(Y)
Q: The following table gives the distribution of gas bills (GB’s) of some households (hhs) in a city-…
A: Given data :
Q: Q. 4 The pdf of the age-of babies, x years, being brought to a clinic is given by /(x) =D글제(2-x);…
A:
Q: In order to study the effects of World War Il on a certain country's economy, an economist used data…
A: Gini index is double the area between the Lorenz curve and the line of perfect equality = 200 x…
Q: d. The probability that the wave will crash onto the beach between 0.2 and 3.3 seconds after the…
A:
Q: We are interested in using the pH of the lake water (which is easy to measure) to predict the…
A: The following data is given: Observations 1 2 3 4 5 6 7 8 9 10 pH (x) 8.2 8.4 7.0 7.2 7.3 6.4…
Q: 11. Find out the likely production corresponding to a rainfall of 40 cms. from the following däta :…
A: Regression: By regression we mean estimation or prediction of the average value of one variable for…
Q: In order to study the effects of World War II on a certain country's economy, an economist used data…
A: The correct option is (A). Use the theoretical distribution approach to calculate the Gini index.…
Q: In order to study the effects of World War II on a certain country's economy, an economist used data…
A: Given fx=x2.3 Lorenz curve for 1935fx=x1.6 Lorenz curve for 1947
Q: The correlation between X and Y is r = 0.35. %3D Based on this r value, is this a good equation to…
A:
Q: X has PDF f(x) = #/2 if0<x <2 0 otherwise What is the 17th percentile?
A:
Q: What is indicated by a Pearson correlation of r +1.00 between X and Y? O Every increase in X causes…
A: Solution: From the given information, r=+1.
Q: Which of the following best describes the variability of T1 and T2 ? Tị has a lower variability…
A: T1 has a lower variability compared with T2 as we can see that the graph of T2 is more flattened out…
Q: A new insecticide is advertised to kill more than 95% roaches upon contact. In a laboratory test,…
A: Given, The sample proportion is,
Q: Suppose f(x) = 1/20 from 5 to 25. What is the 25th percentile of X? %3D 10 1/20 None of the other…
A: F(x) = 1/20 from 5 to 25
Q: You are conducting a study to see if the proportion of women over 40 who regularly have mammograms…
A: Null and alternate hypotheses: The investigator is specifically interested to check whether the…
Q: A random sample of n1 = 20 winter days in Denver gave a sample mean pollution index x1 = 43.…
A: Given n1= sample size of of winter days in Denver =20X1 =sample mean of winter days in Denver =…
Q: Consider the following data relating hours spent studying (X) and average grade on course quizzes…
A: Given Information: The data represents relating hours spent studying (X) and average grade on…
Q: The mean ±1 sd of ln [calcium intake (mg)] among 25 females, 12 to 14 years of age, below the…
A: Given, The mean ±1 sd of ln [calcium intake (mg)] among 25 females, 12 to 14 years of age, below the…
Q: Consider the following data relating hours spent studying (X) and average grade on course quizzes…
A: Given Information: The data represents hours spent studying and the average grade on course quizzes.…
Q: Suppose that x has an exponential distribution with θ =1.5. Find P(x > 1
A: The probability distribution is given by: f(x) =1.5e(-1.5x) for x>0
In Problems 3–6, use the figure to solve each inequality.
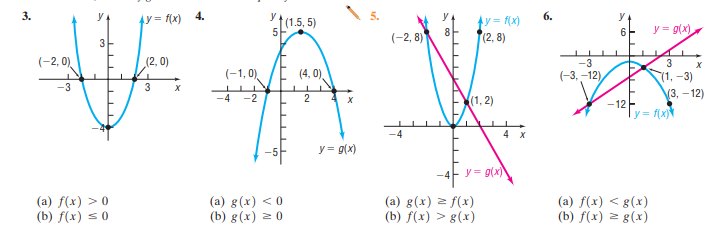
Step by step
Solved in 2 steps
- What does the y -intercept on the graph of a logistic equation correspond to for a population modeled by that equation?Table 6 shows the population, in thousands, of harbor seals in the Wadden Sea over the years 1997 to 2012. a. Let x represent time in years starting with x=0 for the year 1997. Let y represent the number of seals in thousands. Use logistic regression to fit a model to these data. b. Use the model to predict the seal population for the year 2020. c. To the nearest whole number, what is the limiting value of this model?Find the average rates of change of f(x)=x2+2x (a) from x1=3 to x2=2 and (b) from x1=2 to x2=0.
- The U.S. Bureau of the Census prediction for the percentage of the population 65 years and older can be modeled as p(x) = −0.00022x3 + 0.014x2 − 0.0033x + 12.236 percent where x is the number of years since 2000, data from 0 ≤ x ≤ 50. 1. Determine the value of x in the domain 0 ≤ x ≤ 50 for which the percentage is predicted to be increasing most rapidly (Round your answer to three decimal places). 2. Thus, in which year is the percentage is predicted to be increasing most rapidly? 3. Calculate the percentage at that time. (Round your answer to two decimal places.) 4. Calculate the rate of change of the percentage at that time. (Round your answer to three decimal places.)A positive value of the correlation coefficient "r" means_________ Group of answer choices that when x increases, y tends to increase and when x decreases, y tends to decrease that when x increases, y tends to increase and when x increases, y tends to decrease that when x increases, y tends to decrease and when x decreases, y tends to increase15. For several years researchers have noticed that thereappears to be a regular, year-by-year increase in theaverage IQ for the general population. Thisphenomenon is called the Flynn effect after theresearcher who first reported it (Flynn, 1984, 1999),and it means that psychologists must continuouslyupdate IQ tests to keep the population mean at 100. To evaluate the size of the effect, aresearcher obtained a 10-year-old IQ test that wasstandardized to produce a mean IQ of 100 for thepopulation 10 years ago. The test was then given to asample of n 64 of today’s 20-year-old adults. Theaverage score for the sample was M 107 with astandard deviation of s 12.a. Based on the sample, is the average IQ for today’spopulation significantly different from the average10 years ago, when the test would have producesa mean of 100? Use a two-tailed test with.01.b. Make an 80% confidence interval estimate oftoday’s population mean IQ for the 10-year-old test.
- A chemical reaction is run 12 times, and the temperature xi (in °C) and the yield yi (in percent of a theoretical maximum) is recorded each time. The following summary statistics are recorded: x⎯⎯=65.0, y⎯⎯=29.03,∑ni=1(xi−x⎯⎯)2=6032.0,∑ni=1(yi−y⎯⎯)2=835.42,∑ni=1(xi−x⎯⎯)(yi−y⎯⎯)=1988.6x¯=65.0, y¯=29.03,∑i=1n(xi−x¯)2=6032.0,∑i=1n(yi−y¯)2=835.42,∑i=1n(xi−x¯)(yi−y¯)=1988.6 Let β0 represent the hypothetical yield at a temperature of 0°C, and let β1 represent the increase in yield caused by an increase in temperature of 1°C. Assume that assumptions 1 through 4 for errors in linear models hold. Find a 95% prediction interval for the yield of a particular reaction at a temperature of 40°C. Round the answers to three decimal places. The 95% prediction interval is ( , ).A chemical reaction is run 12 times, and the temperature xi (in °C) and the yield yi (in percent of a theoretical maximum) is recorded each time. The following summary statistics are recorded: x⎯⎯=65.0, y⎯⎯=29.03,∑ni=1(xi−x⎯⎯)2=6032.0,∑ni=1(yi−y⎯⎯)2=835.42,∑ni=1(xi−x⎯⎯)(yi−y⎯⎯)=1988.6x¯=65.0, y¯=29.03,∑i=1n(xi−x¯)2=6032.0,∑i=1n(yi−y¯)2=835.42,∑i=1n(xi−x¯)(yi−y¯)=1988.6 Let β0 represent the hypothetical yield at a temperature of 0°C, and let β1 represent the increase in yield caused by an increase in temperature of 1°C. Assume that assumptions 1 through 4 for errors in linear models hold. Compute the error variance estimate s2. Round the answer to three decimal places.A chemical reaction is run 12 times, and the temperature xi (in °C) and the yield yi (in percent of a theoretical maximum) is recorded each time. The following summary statistics are recorded: x⎯⎯=65.0, y⎯⎯=29.03,∑ni=1(xi−x⎯⎯)2=6032.0,∑ni=1(yi−y⎯⎯)2=835.42,∑ni=1(xi−x⎯⎯)(yi−y⎯⎯)=1988.5x¯=65.0, y¯=29.03,∑i=1n(xi−x¯)2=6032.0,∑i=1n(yi−y¯)2=835.42,∑i=1n(xi−x¯)(yi−y¯)=1988.5 Let β0 represent the hypothetical yield at a temperature of 0°C, and let β1 represent the increase in yield caused by an increase in temperature of 1°C. Assume that assumptions 1 through 4 for errors in linear models hold. Find 95% confidence intervals for β0 and β1. Round the answers to three decimal places. The 95% confidence interval for β0 is ( , ). The 95% confidence interval for β1 is ( , ).
- The mean ±1 sd of ln [calcium intake (mg)] among 25females, 12 to 14 years of age, below the poverty level is6.56 ± 0.64. Similarly, the mean ± 1 sd of ln [calcium intake(mg)] among 40 females, 12 to 14 years of age, above thepoverty level is 6.80 ± 0.76 4-What is the p-value corresponding to your answer toProblem 8.4?Suppose the correlation, r, between two variables x and y is –0.44. What percentage of the variability in y cannot be explained by x?William Profit is studying companies going public for the first time. He isparticularly interested in the relationship between the size of the offering and theprice per share. A sample of 15 companies that recently went public revealed the following information: y x 10.8 9 11.3 94.4 11.2 27.3 11.1 179.2 11.1 71.9 11.2 97.9 11 93.5 10.7 70 11.3 160.7 10.6 96.5 10.5 83 10.3 23.5 10.7 58.7 11 93.8 10.8 34.4