
Concept explainers
Videos
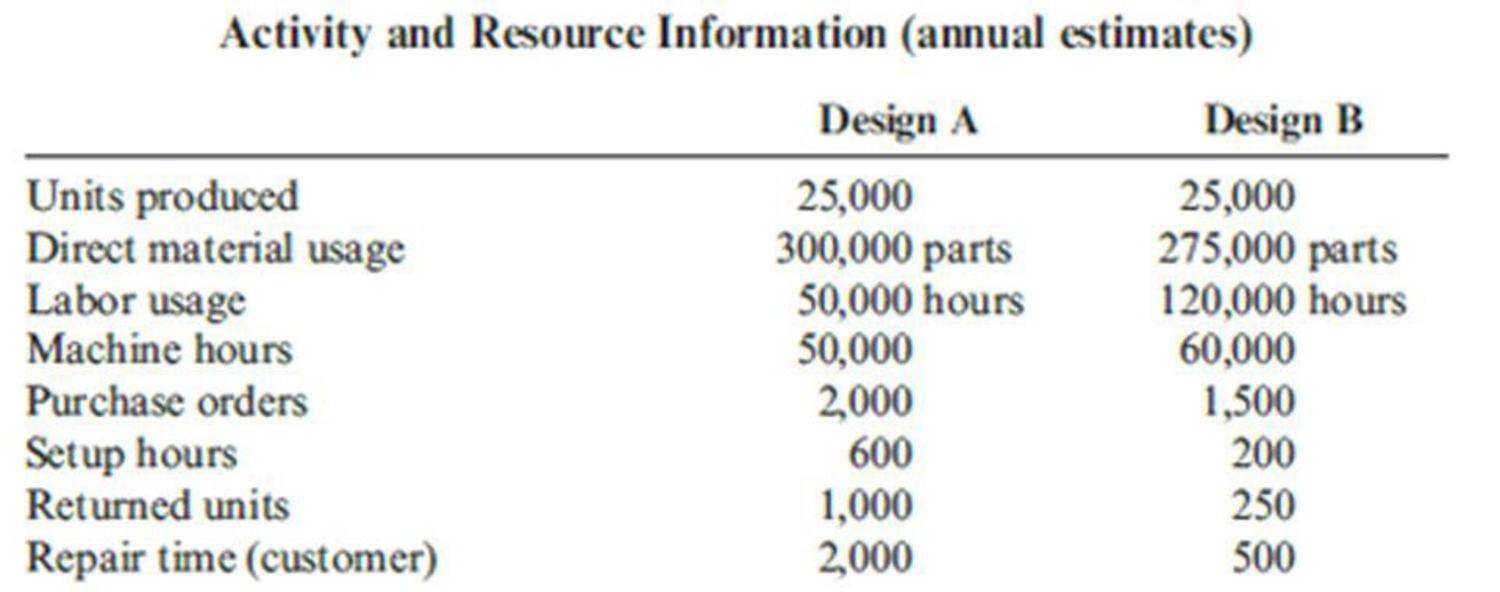
Kagle design engineers are in the process of developing a new “green” product, one that will significantly reduce impact on the environment and yet still provide the desired customer functionality. Currently, two designs are being considered. The manager of Kagle has told the engineers that the cost for the new product cannot exceed $550 per unit (target cost). In the past, the Cost Accounting Department has given estimated costs using a unit-based system. At the request of the Engineering Department, Cost Accounting is providing both unit-and activity-based accounting information (made possible by a recent pilot study producing the activity-based data).
Unit-based system:
Variable conversion activity rate: $100 per direct labor hour
Material usage rate: $20 per part
ABC system:
Labor usage: $15 per direct labor hour
Material usage (direct materials): $20 per part
Machining: $75 per machine hour
Purchasing activity: $150 per purchase order
Setup activity: $3,000 per setup hour
Warranty activity: $500 per returned unit (usually requires extensive rework)
Customer repair cost: $25 per repair hour (average)
Required:
- 1. Select the lower-cost design using unit-based costing. Are logistical and post-purchase activities considered in this analysis?
- 2. Select the lower-cost design using ABC analysis. Explain why the analysis differs from the unit-based analysis.
- 3. What if the post-purchase cost was an environmental contaminant and amounted to $10 per unit for Design A and $40 per unit for Design B? Assume that the environmental cost is borne by society. Now which is the better design?

Trending nowThis is a popular solution!

Chapter 11 Solutions
Cornerstones of Cost Management (Cornerstones Series)


- Jolene Askew, manager of Feagan Company, has committed her company to a strategically sound cost reduction program. Emphasizing life-cycle cost management is a major part of this effort. Jolene is convinced that production costs can be reduced by paying more attention to the relationships between design and manufacturing. Design engineers need to know what causes manufacturing costs. She instructed her controller to develop a manufacturing cost formula for a newly proposed product. Marketing had already projected sales of 25,000 units for the new product. (The life cycle was estimated to be 18 months. The company expected to have 50 percent of the market and priced its product to achieve this goal.) The projected selling price was 20 per unit. The following cost formula was developed: Y=200,000+10X1 where X1=Machinehours(Theproductisexpectedtouseonemachinehourforeveryunitproduced.) Upon seeing the cost formula, Jolene quickly calculated the projected gross profit to be 50,000. This produced a gross profit of 2 per unit, well below the targeted gross profit of 4 per unit. Jolene then sent a memo to the Engineering Department, instructing them to search for a new design that would lower the costs of production by at least 50,000 so that the target profit could be met. Within two days, the Engineering Department proposed a new design that would reduce unit-variable cost from 10 per machine hour to 8 per machine hour (Design Z). The chief engineer, upon reviewing the design, questioned the validity of the controllers cost formula. He suggested a more careful assessment of the proposed designs effect on activities other than machining. Based on this suggestion, the following revised cost formula was developed. This cost formula reflected the cost relationships of the most recent design (Design Z). Y=140,000+8X1+5,000X2+2,000X3 where X1=MachinehoursX2=NumberofbatchesX3=Numberofengineeringchangeorders Based on scheduling and inventory considerations, the product would be produced in batches of 1,000; thus, 25 batches would be needed over the products life cycle. Furthermore, based on past experience, the product would likely generate about 20 engineering change orders. This new insight into the linkage of the product with its underlying activities led to a different design (Design W). This second design also lowered the unit-level cost by 2 per unit but decreased the number of design support requirements from 20 orders to 10 orders. Attention was also given to the setup activity, and the design engineer assigned to the product created a design that reduced setup time and lowered variable setup costs from 5,000 to 3,000 per setup. Furthermore, Design W also creates excess activity capacity for the setup activity, and resource spending for setup activity capacity can be decreased by 40,000, reducing the fixed cost component in the equation by this amount. Design W was recommended and accepted. As prototypes of the design were tested, an additional benefit emerged. Based on test results, the post-purchase costs dropped from an estimated 0.70 per unit sold to 0.40 per unit sold. Using this information, the Marketing Department revised the projected market share upward from 50 percent to 60 percent (with no price decrease). Required: 1. Calculate the expected gross profit per unit for Design Z using the controllers original cost formula. According to this outcome, does Design Z reach the targeted unit profit? Repeat, using the engineers revised cost formula. Explain why Design Z failed to meet the targeted profit. What does this say about the use of unit-based costing for life-cycle cost management? 2. Calculate the expected profit per unit using Design W. Comment on the value of activity information for life-cycle cost management. 3. The benefit of the post-purchase cost reduction of Design W was discovered in testing. What direct benefit did it create for Feagan Company (in dollars)? Reducing post-purchase costs was not a specific design objective. Should it have been? Are there any other design objectives that should have been considered?arrow_forwardGumbrecht Company has the following departmental manufacturing layout for one of its plants: A consulting firm has recommended a value stream with the following manufacturing cell: Required: 1. Calculate the total time it takes to produce a batch of 20 units using the traditional departmental manufacturing layout. 2. Using cellular manufacturing, how much time is saved producing the same batch of 20 units? Assuming the cell operates continuously, what is the production rate? Which process controls this production rate? 3. Assume the processing time of Casting is reduced to 9 minutes, while the times of the other processes stay the same. What is the production rate now, and how long will it take to produce a batch of 20 units if the cell is in a continuous production mode?arrow_forwardAnderson Company has the following departmental manufacturing structure for one of its products: After some study, the production manager of Anderson recommended the following revised cellular manufacturing approach: Required: 1. Calculate the total time it takes to produce a batch of 20 units using Andersons traditional departmental structure. 2. Using cellular manufacturing, how much time is saved producing the same batch of 20 units? Assuming the cell operates continuously, what is the production rate? Which process controls this production rate? 3. What if the processing times of molding, welding, and assembly are all reduced to six minutes each? What is the production rate now, and how long will it take to produce a batch of 20 units?arrow_forward
- Salem Electronics currently produces two products: a programmable calculator and a tape recorder. A recent marketing study indicated that consumers would react favorably to a radio with the Salem brand name. Owner Kenneth Booth was interested in the possibility. Before any commitment was made, however, Kenneth wanted to know what the incremental fixed costs would be and how many radios must be sold to cover these costs. In response, Betty Johnson, the marketing manager, gathered data for the current products to help in projecting overhead costs for the new product. The overhead costs based on 30,000 direct labor hours follow. (The high-low method using direct labor hours as the independent variable was used to determine the fixed and variable costs.) All depreciation. The following activity data were also gathered: Betty was told that a plantwide overhead rate was used to assign overhead costs based on direct labor hours. She was also informed by engineering that if 20,000 radios were produced and sold (her projection based on her marketing study), they would have the same activity data as the recorders (use the same direct labor hours, machine hours, setups, and so on). Engineering also provided the following additional estimates for the proposed product line: Upon receiving these estimates, Betty did some quick calculations and became quite excited. With a selling price of 26 and just 18,000 of additional fixed costs, only 4,500 units had to be sold to break even. Since Betty was confident that 20,000 units could be sold, she was prepared to strongly recommend the new product line. Required: 1. Reproduce Bettys break-even calculation using conventional cost assignments. How much additional profit would be expected under this scenario, assuming that 20,000 radios are sold? 2. Use an activity-based costing approach, and calculate the break-even point and the incremental profit that would be earned on sales of 20,000 units. 3. Explain why the CVP analysis done in Requirement 2 is more accurate than the analysis done in Requirement 1. What recommendation would you make?arrow_forwardMoisha is developing material standards for her company. The operations manager wants grade A widgets because they are the easiest to work with and are the quality the customers want. Grade B will not work because customers do not want the lower grade, and it takes more time to assemble the product than with grade A materials. Moisha calls several suppliers to get prices for the widget. All are within $0.05 of each other. Since they will use millions of widgets, she decides that the $0.05 difference is important. The supplier who has the lowest price is known for delivering late and low-quality materials. Moisha decides to use the supplier who is $0.02 more but delivers on time and at the right quality. This supplier charges $0.48 per widget. Each unit of product requires four widgets. What is the standard cost per unit for widgets?arrow_forwardHudson Corporation is considering three options for managing its data warehouse: continuing with its own staff, hiring an outside vendor to do the managing, or using a combination of its own staff and an outside vendor. The cost of the operation depends on future demand. The annual cost of each option (in thousands of dollars) depends on demand as follows: If the demand probabilities are 0.2, 0.5, and 0.3, which decision alternative will minimize the expected cost of the data warehouse? What is the expected annual cost associated with that recommendation? Construct a risk profile for the optimal decision in part (a). What is the probability of the cost exceeding $700,000?arrow_forward
- Randy Harris, controller, has been given the charge to implement an advanced cost management system. As part of this process, he needs to identify activity drivers for the activities of the firm. During the past four months, Randy has spent considerable effort identifying activities, their associated costs, and possible drivers for the activities costs. Initially, Randy made his selections based on his own judgment using his experience and input from employees who perform the activities. Later, he used regression analysis to confirm his judgment. Randy prefers to use one driver per activity, provided that an R2 of at least 80 percent can be produced. Otherwise, multiple drivers will be used, based on evidence provided by multiple regression analysis. For example, the activity of inspecting finished goods produced an R2 of less than 80 percent for any single activity driver. Randy believes, however, that a satisfactory cost formula can be developed using two activity drivers: the number of batches and the number of inspection hours. Data collected for a 14-month period are as follows: Required: 1. Calculate the cost formula for inspection costs using the two drivers, inspection hours and number of batches. Are both activity drivers useful? What does the R2 indicate about the formula? 2. Using the formula developed in Requirement 1, calculate the inspection cost when 300 inspection hours are used and 30 batches are produced. Prepare a 90 percent confidence interval for this prediction.arrow_forwardBienestar Inc., has the following departmental structure for producing a well-known multivitamin: A consultant designed the following cellular manufacturing structure for the same product: The times above the processes represent the time required to process one unit of product. Required: 1. Calculate the time required to produce a batch of 15 bottles using a batch-processing departmental structure. 2. Calculate the time to process 15 units using cellular manufacturing. 3. How much manufacturing time will the cellular manufacturing structure save for a batch of 15 units?arrow_forwardAbernathy, Inc., produces two different generators and is concerned about their quality. The company has identified the following quality activities and costs associated with the two products: Required: 1. Calculate the quality cost per unit for each product, and break this unit cost into quality cost categories. Which of the two seems to have the lowest quality? 2. How might a manager use the unit quality cost information?arrow_forward
- Kelson Sporting Equipment, Inc., makes two types of baseball gloves: a regular model and a catchers model. The firm has 900 hours of production time available in its cutting and sewing department, 300 hours available in its finishing department, and 100 hours available in its packaging and shipping department. The production time requirements and the profit contribution per glove are given in the following table: Assuming that the company is interested in maximizing the total profit contribution, answer the following: a. What is the linear programming model for this problem? b. Develop a spreadsheet model and find the optimal solution using Excel Solver. How many of each model should Kelson manufacture? c. What is the total profit contribution Kelson can earn with the optimal production quantities? d. How many hours of production time will be scheduled in each department? e. What is the slack time in each department?arrow_forwardBristol is developing material standards for her company. The operations manager wants grade A plastic tops because they are the easiest to work with and are the quality the customers want. Grade B will not work because customers do not want the lower grade, and it takes more time to assemble the product than with grade A materials. Bristol calls several suppliers to get prices for the plastic top. All are within $0.10 of each other. Since the company will use millions of the plastic tops, she decides that the $0.10 difference is important. The supplier who has the lowest price is known for delivering late and low- quality materials. Bristol decides to use the supplier who is $0.04 more but delivers on time and at the right quality. This supplier charges $0.52 per plastic top. Each unit of product requires six plastic tops. What is the standard cost per unit for plastic tops?arrow_forwardEvans, Inc., has a unit-based costing system. Evanss Miami plant produces 10 different electronic products. The demand for each product is about the same. Although they differ in complexity, each product uses about the same labor time and materials. The plant has used direct labor hours for years to assign overhead to products. To help design engineers understand the assumed cost relationships, the Cost Accounting Department developed the following cost equation. (The equation describes the relationship between total manufacturing costs and direct labor hours; the equation is supported by a coefficient of determination of 60 percent.) Y=5,000,000+30X,whereX=directlaborhours The variable rate of 30 is broken down as follows: Because of competitive pressures, product engineering was given the charge to redesign products to reduce the total cost of manufacturing. Using the above cost relationships, product engineering adopted the strategy of redesigning to reduce direct labor content. As each design was completed, an engineering change order was cut, triggering a series of events such as design approval, vendor selection, bill of materials update, redrawing of schematic, test runs, changes in setup procedures, development of new inspection procedures, and so on. After one year of design changes, the normal volume of direct labor was reduced from 250,000 hours to 200,000 hours, with the same number of products being produced. Although each product differs in its labor content, the redesign efforts reduced the labor content for all products. On average, the labor content per unit of product dropped from 1.25 hours per unit to one hour per unit. Fixed overhead, however, increased from 5,000,000 to 6,600,000 per year. Suppose that a consultant was hired to explain the increase in fixed overhead costs. The consultants study revealed that the 30 per hour rate captured the unit-level variable costs; however, the cost behavior of other activities was quite different. For example, setting up equipment is a step-fixed cost, where each step is 2,000 setup hours, costing 90,000. The study also revealed that the cost of receiving goods is a function of the number of different components. This activity has a variable cost of 2,000 per component type and a fixed cost that follows a step-cost pattern. The step is defined by 20 components with a cost of 50,000 per step. Assume also that the consultant indicated that the design adopted by the engineers increased the demand for setups from 20,000 setup hours to 40,000 setup hours and the number of different components from 100 to 250. The demand for other non-unit-level activities remained unchanged. The consultant also recommended that management take a look at a rejected design for its products. This rejected design increased direct labor content from 250,000 hours to 260,000 hours, decreased the demand for setups from 20,000 hours to 10,000 hours, and decreased the demand for purchasing from 100 component types to 75 component types, while the demand for all other activities remained unchanged. Required: 1. Using normal volume, compute the manufacturing cost per labor hour before the year of design changes. What is the cost per unit of an average product? 2. Using normal volume after the one year of design changes, compute the manufacturing cost per hour. What is the cost per unit of an average product? 3. Before considering the consultants study, what do you think is the most likely explanation for the failure of the design changes to reduce manufacturing costs? Now use the information from the consultants study to explain the increase in the average cost per unit of product. What changes would you suggest to improve Evanss efforts to reduce costs? 4. Explain why the consultant recommended a second look at a rejected design. Provide computational support. What does this tell you about the strategic importance of cost management?arrow_forward
 Cornerstones of Cost Management (Cornerstones Ser...AccountingISBN:9781305970663Author:Don R. Hansen, Maryanne M. MowenPublisher:Cengage Learning
 Managerial Accounting: The Cornerstone of Busines...AccountingISBN:9781337115773Author:Maryanne M. Mowen, Don R. Hansen, Dan L. HeitgerPublisher:Cengage Learning
 Principles of Accounting Volume 2AccountingISBN:9781947172609Author:OpenStaxPublisher:OpenStax College
 Essentials of Business Analytics (MindTap Course ...StatisticsISBN:9781305627734Author:Jeffrey D. Camm, James J. Cochran, Michael J. Fry, Jeffrey W. Ohlmann, David R. AndersonPublisher:Cengage Learning
 Financial And Managerial AccountingAccountingISBN:9781337902663Author:WARREN, Carl S.Publisher:Cengage Learning,
 Managerial AccountingAccountingISBN:9781337912020Author:Carl Warren, Ph.d. Cma William B. TaylerPublisher:South-Western College Pub