
Videos
The results of a study on the effectiveness of line drying on the smoothness of fabric were summarized in the article “Line-Dried vs. Machine-Dried Fabrics: Comparison of Appearance, Hand, and Consumer Acceptance” (Home Econ. Research J., 1984: 27–35). Smoothness scores were given for nine different types of fabric and five different drying methods: (1) machine dry, (2) line dry, (3) line dry followed by 15-min tumble, (4) line dry with softener, and (5) line dry with air movement. Regarding the different types of fabric as blocks, construct an ANOVA table. Using a .05 significance level, test to see whether there is a difference in the true mean smoothness score for the drying methods.
| Drying Method | ||||||
| Fabric | 1 | 2 | 3 | 4 | 5 | |
| Crepe | 3.3 | 2.5 | 2.8 | 2.5 | 1.9 | |
| Double knit | 3.6 | 2.0 | 3.6 | 2.4 | 2.3 | |
| Twill | 4.2 | 3.4 | 3.8 | 3.1 | 3.1 | |
| Twill mix | 3.4 | 2.4 | 2.9 | 1.6 | 1.7 | |
| Terry | 3.8 | 1.3 | 2.8 | 2.0 | 1.6 | |
| Broadcloth | 2.2 | 1.5 | 2.7 | 1.5 | 1.9 | |
| Sheeting | 3.5 | 2.1 | 2.8 | 2.1 | 2.2 | |
| Corduroy | 3.6 | 1.3 | 2.8 | 1.7 | 1.8 | |
| Denim | 2.6 | 1.4 | 2.4 | 1.3 | 1.6 | |
Test the hypothesis to see whether there is any significant difference in the mean smoothness score due to the drying methods at 5% level of significance.
Answer to Problem 50SE
There is sufficient of evidence to conclude that there is significant difference in the mean smoothness score due to the drying methods at 5% level of significance.
Explanation of Solution
The data shows the mean smoothness of the fabric for five levels of drying methods with nine different types of fabrics..
Calculation:
There is no significant difference in the mean smoothness with respect to the five levels of drying methods.
There is difference in the mean smoothness with respect to the five levels of drying methods.
Software procedure:
Step by step procedure to find the test statistic using Minitab is given below:
- Click on Stat>ANOVA>Two-Way Analysis of Variance.
- Under Response, enter the column of mean smoothness.
- Under Row factor, enter the column of drying method.
- Under column factor, enter the column of fabric.
- Click OK.
Output obtained from MINITAB is given below:
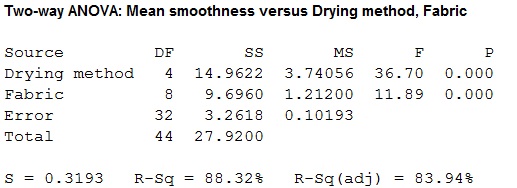
Conclusion:
For drying methods:
The P-value for the drying methods is 0.000 and the level of significance is 0.05.
Here, the P-value is lesser than the level of significance.
That is,
Thus, the null hypothesis is rejected
Hence, there is sufficient evidence to conclude that there is an effect of drying methods on the mean smoothness of the fabric at 5% level of significance.
Want to see more full solutions like this?
Chapter 11 Solutions
Probability and Statistics for Engineering and the Sciences


- Recently, researchers have begun to focus on the relationship between potentially toxic environmental exposures in children to a number of adverse health outcomes. Suppose one such researcher wants to investigate the relationship between lead levels in soil (micrograms/dL) and BMI (kg/m2). The following table represents a SRS of households with the corresponding exterior lead levels and BMI of a randomly sampled child in the home. Lead levels BMI 13.6 19.7 14.3 19.9 9.7 20.1 9.4 22.1 11.4 19.8 10.9 21.6 A) Write out the null and alternative hypotheses for a formal test of significance testing the correlation between the two variables and calulate a t statistic and interpret your pvalue and results.arrow_forwardAn article in the Journal of Quality Technology (Vol. 13, No. 2, 1981, pp. 111–114) describes an experimentthat investigates the effects of four bleaching chemicals on pulp brightness. These four chemicals wereselected at random from a large population of potential bleaching agents. The data are as follows:a. Test the significance of these chemical types with α=0.05.b. If proven significant, perform a multiple comparison method using Fisher’s LSDarrow_forwardThe National Transportation Safety Board wants to look at the safety of three different sizes of cars. Using the data below, determine the whether the mean pressure applied to the driver`s head during a crash is equal for each type of car at alpha = 0.01 Compact cars Midsize cars Full-size Cars 643 469 484 655 427 456 702 525 402 a) Ho: Ha : b) Decision c) Conclusionarrow_forward
- The dry shear strength of birch plywood bonded with different resin glues was studied with a completely randomized designed experiment. Here are the data: Glue A (102; 58; 45; 79; 68; 63; 117) Glue C (100; 102; 80; 119) Glue F (220; 243; 189; 176; 176). What is the F critical value at the 2.5% significance levelarrow_forwardLeisure Activities and Dementia. An article appearing in the Los Angeles Times discussed the study “Leisure Activities and the Risk of Dementia in the Elderly” (New England Journal of Medicine, Vol. 348) by J.Verghese et al. The article in the Times, titled “Crosswords Reduce Risk of Dementia,” contained the following statement: “Elderly people who frequently read, do crossword puzzles, practice a musical instrument or play board games cut their risk of Alzheimer’s and other forms of dementia by nearly two-thirds compared with people who seldom do such activities.” Comment on thestatement in quotes, keeping in mind the type of study for which causation can be reasonably inferred.arrow_forwardA Canadian study measuring depression level in teens (as reported in the Journal of Adolescence, vol. 25, 2002) randomly sampled 112 male teens and 101 female teens, and scored them on a common depression scale (higher score representing more depression). The researchers suspected that the mean depression score for male teens is higher than for female teens, and wanted to check whether data would support this hypothesis. If μ1 and μ2 represent the mean depression score for male teens and female teens respectively, which of the following is an appropriate pair of hypotheses in this case? Check all that apply.arrow_forward
- In its January 25, 2012, issue, the Journal of the American Medical Association reported on the effects of overconsumption of low, normal, and high protein diets on weight gain, energy expenditure, and body composition. Researchers conducted a single blind, randomized controlled trial of 25 U.S. adults. The subjects were healthy, weight-stable, male and female volunteers, aged 18 to 35 years. All subjects consumed a weight-stabilizing diet for 13 to 25 days. Afterwards, the researchers randomly assigned participants to diets containing various percentages of energy from protein: 5% (low protein), 15% (normal protein), or 25% (high protein). The subjects were not aware of the specific protein level diet to which they were assigned. On these diets the researchers overfed the participants during the last 8 weeks of their 10 to 12 week stay in the inpatient metabolic unit. The goal was to investigate the effect of overconsumption of protein on weight gain, energy expenditure, and body…arrow_forwardPulmonary Hypertension. In the paper “Persistent Pulmonary Hypertension of the Neonate and Asymmetric Growth Restriction” (Obstetrics&Gynecology, Vol. 91, No. 3, pp. 336–341), M. Williams et al. reported on a study of characteristics of neonates. Infants treated for pulmonary hypertension, called the PH group, were compared with those not so treated, called the control group. One of the characteristics measured was head circumference. The mean head circumference of the 10 infants in the PH group was 34.2 centimeters (cm). a. Assuming that head circumferences for infants treated for pulmonary hypertension are normally distributed with standard deviation 2.1 cm, determine a 90% confidence interval for the mean head circumference of all such infants. b. Obtain the margin of error, E, for the confidence interval you found in part (a). c. Explain the meaning of E in this context in terms of the accuracy of the estimate. d. Determine the sample size required to have a margin of error of…arrow_forwardAn article23 summarized results from the Nurses’ Health Study and the Health Pro- fessionals Follow-Up Study. The article reported (with RR = relative risk) that “Com- pared with nonregular use, regular aspirin use was associated with lower risk of overall cancer (RR 0.97; 95% CI 0.94, 0.99), which was primarily due to a lower incidence of gastrointestinal cancers, especially colorectal cancers (RR 0.81; 95% CI 0.75, 0.88).” Identify the response variables and the explanatory variable for these two results. Explain how to interpret the confidence interval about colorectal cancers. Would the association with overall cancer be considered (i) significant or non- significant? (ii) strong or weak? Explain. question 1 and 2arrow_forward
- Downs and Abwender (2002) evaluated soccer players and swimmers to determine whether the routine blows to the head experienced by soccer players produced long term neurological deficits. In the study, neurological tests were administered to mature soccer players and swimmers and the results indicated significant differences. In a similar study, a researcher obtained the following data. Swimmers Soccer Players 10 7 8 4 7 9 9 3 13 7 7 6 12 a)Are the neurological test scores significantly lower for the soccer player than for the swimmers in the control groups? Use a one-tailed test with = .05. b)Compute the value of r² (percentage of variance accounted for) these data.arrow_forwardPeanut Allergies. In the article “Food Allergy Advice May Be Peanuts” (Science News, Vol. 174, No. 12, pp. 8–9), N. Seppa reports that early exposure to peanuts seems to lessen the risk of nut allergy. Of 4000 Jewish children sampled in Britain, 1.85% had peanut allergies; and of 4600 Jewish children sampled in Israel, where early peanut consumption is more common, 0.17% had peanut allergies. The researcher chose Jewish children in both countries to limit genetic differences between groups. a. Is this study descriptive or inferential? b. Is this study observational or experimental?arrow_forwardA researcher wanted to determine if carpeted rooms contain more bacteria than uncarpeted rooms. The table shows the results for the number of bacteria per cubic foot for both types of rooms. Full data set Carpeted Uncarpeted 7.5 14.9 9.4 5.1 10.6 4.2 9.2 12.7 9.9 13.3 9.3 4.2 6.9 11.1 7.5 12.5 Determine whether carpeted rooms have more bacteria than uncarpeted rooms at the α=0.05 level of significance. Normal probability plots indicate that the data are approximately normal and boxplots indicate that there are no outliers. State the null and alternative hypotheses. Let population 1 be carpeted rooms and population 2 be uncarpeted rooms. A. H0: μ1=μ2 H1: μ1>μ2 This is the correct answer. B. H0: μ1<μ2 H1: μ1>μ2 C. H0: μ1=μ2 H1: μ1≠μ2 D. H0: μ1=μ2 H1: μ1<μ2 Your answer is not correct. Determine the P-value for this hypothesis test. P-value=nothing…arrow_forward
 Glencoe Algebra 1, Student Edition, 9780079039897...AlgebraISBN:9780079039897Author:CarterPublisher:McGraw Hill