
Videos
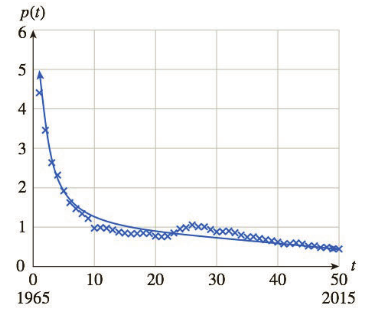
Funding for NASA: 1966-2015 The percentage of the U.S. federal budget allocated to NASA from 1966 to 2015 can be approximated by
The following graph shows the data with the model:
a. Find an appropriate domain of p. Is
b. Compute
c. If the model is extrapolated to larger and larger values of t, what does it suggest about long-term financing of NASA?

Trending nowThis is a popular solution!

Chapter 1 Solutions
Applied Calculus


- World Crude Oil Production In 1956, M.King Hubbert proposed a model to analyse crude oil production. His model, with updated data, gives world crude oil production as P=254.43e0.042t(1+2.12e0.042t)2 Here P is measured in billions of barrels per year, and t is time, in year, since 2000. a.Make a graph of world crude oil production for 2000 through 2040. b.When does this model predict a peak in world crude oil production? c.What is the maximum crude oil production predicted by this model?arrow_forwardPopulation Statistics The table shows the life expectancies of a child (at birth) in the United States for selected years from 1940 through 2010. A model for the life expectancy during this period is y=63.6+0.97t1+0.01t,0t70 Where y represents the life expectancy and t is the time in years, with t = 0 corresponding to 1940. (a) Use a graphing utility to graph the data from the table and the model in the same viewing window. How well does the model fit the data? Explain. (b) Determine the life expectancy in 1990 both graphically and algebraically. (c) Use the graph to determine the year when life expectancy was approximately 70.1. verify your answer algebraically. (d) Find the y-intercept of the graph of the model. What does it represent in the context of the problem? (e) Do you think this model can be used to predict the life expectancy of a child 50 years from now?arrow_forwardSales Growth In this exercise, we develop a model for the growth rate G, in thousands of dollars per year, in sales of the product as a function of the sales level s, in thousands of dollars. The model assumes that there is a limit to the total amount of sales that can be attained. In this situation, we use the term unattained sales for difference this limit and the current sales level. For example, if we expect sales grow to 3 thousand dollars in the long run, then 3-s is the unattained sales. The model states that the growth rate G is proportional to the product of the sales level s, and the unattained sales. Assume that the constant of proportionality is 0.3 and that the sales grow to 2 thousand dollars in the long run. a.Find the formula for unattained sales. b.Write an equation that shows the proportionality relation for G. c.On the basis of the equation from the part b, make a graph of G as a function of s. d.At what sales level is the growth rate as large as possible? e.What is the largest possible growth rate?arrow_forward
- Population Statistics The table shows the life expectancies of a child (at birth) in the United States for selected years from 1940 through 2010. A model for the life expectancy during this period is y=63.6+0.97t1+0.01t,0r70 Where y represents the life expectancy and t is the time in years, with t=0 corresponding to 1940. (a) Use a graphing utility to graph the data from the table and the model in the same viewing window. How well does the model fit the data? Explain (b) Determine the life expectancy in 1990 both graphically and algebraically. (c) Use the graph to determine the year when life expectancy was approximately 70.1. Verify your answer algebraically. (d) Identify the y-intercept of the graph of the model. What does it represent in the context of the problem? (e) Do you think this model can be used to predict the life expectancy of a child 50 years from now? Explainarrow_forwardFlood Control A river is 8 feet above its flood stage. The water is receding at a rate of 3 inches per hour. Write a mathematical model that shows the number of feet above flood stage after t hours. Assuming the water continually recedes at this rate, when will the river be 1 foot above its flood stage?arrow_forward
 Algebra & Trigonometry with Analytic GeometryAlgebraISBN:9781133382119Author:SwokowskiPublisher:Cengage
 Functions and Change: A Modeling Approach to Coll...AlgebraISBN:9781337111348Author:Bruce Crauder, Benny Evans, Alan NoellPublisher:Cengage Learning
 Trigonometry (MindTap Course List)TrigonometryISBN:9781337278461Author:Ron LarsonPublisher:Cengage Learning