
Concept explainers
Videos
Application Exercises
The graphs show the percentage of high school seniors who had ever used alcohol or marijuana.
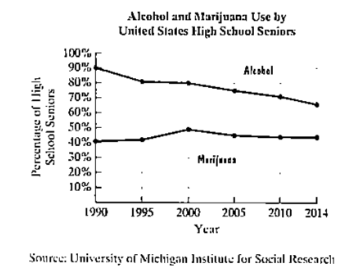
The data can be described by the following mathematical models:

Use this information to solve Exercises 55–56.
a. Use the appropriate line graph to estimate the percentage of seniors who used alcohol in 2014.
b. Use the appropriate formula to determine the percentage of seniors who used alcohol in 2014. How does this compare with your estimate in part (a)?
c. Use the appropriate line graph to estimate the percentage of seniors who used marijuana in 2014.
d. Use the appropriate formula to determine the percentage of seniors who used marijuana in 2014. How does this compare with your estimate in part (c)?
e. For the period from 1990 through 2014, in which year was alcohol use by seniors at a maximum? What percentage of seniors used alcohol in that year.
Want to see the full answer?
Check out a sample textbook solution
Chapter 1 Solutions
EP COLLEGE ALG.MYLAB W/ETEXT -W/ACCESS


- 21–23. Language enrollments. The line graph in Figure 2.28 shows total course enrollments in languages other than English in U.S. institutions of higher education from 1960 to 2009. (Enrollments in ancient Greek and Latin are not included.) Exercises 21 through 23 refer to this figure. 1,800,000 1,629,326 1.522.770 1,600,000 - 1,400,000 - 1347.036 1,200,000- 1,073,097 1,067,217 1,000.000 - 975.7m 963,930 883.222 1.06.603 922,439 960.588 B00,000 - 97.077 877.91 600,000 - 608,749 400.000 - 200,000 - 1960 1965 1968 | 1972 1977 1980 1983 1986 1990 1995 199 2002 2006 2009 1970 1974 Figure 2.28 Crauder, et al., Quantitative Literacy, 3e, © 2019 W. H. Freeman and Company FIGURE 2.28 Enrollments in languages other than English in U.S. institutions of higher education (2009). 21. During which time periods did the enrollments decrease? 22. Calculate the average growth rate per year in enrollments over the two periods 1960–1965 and 2006– 2009. Note that the time periods are not of the same…arrow_forwardanswer A,B,C and Darrow_forwardAmericans' trust in government and the media has generally been on a downward trend since pollsters first asked questions on these topics in the second half of the twentieth century. Trust in government hit an all-time low of 14% in 2014, while trust in the media bottomed out at 32% in 2016. The bar graph shows the percentage of Americans trusting in the government and the media for five selected years. Use this information to answer parts a-c. a. Use the information in the graph to estimate the yearly loss in the percentage of people trusting in government. The yearly loss in the percentage of people trusting in government is 36 %. (Round to the nearest tenth as needed.) b. Write a mathematical model that estimates the percentage, P, of people trusting in government x years after 2003. The mathematical model P = estimates the percentage, P, of people trusting in government x years after 2003. (Use integers or decimals for any numbers in the expression. Use the answer from part (a) to…arrow_forward
- A neighborhood is trying to set up school carpools, but they need to determine the number of students who need to travel to the elementary school (ages 5–10), the middle school (ages 11–13), and the high school (ages 14–18). A histogram summarizes their findings: Histogram titled Carpool, with Number of Children on the y axis and Age Groups on the x axis. Bar 1 is 5 to 10 years old and has a value of 3. Bar 2 is 11 to 13 years old and has a value of 7. Bar 3 is 14 to 18 years old and has a value of 4. Which of the following data sets is represented in the histogram? A. {3, 3, 3, 7, 7, 7, 7, 7, 7, 7, 4, 4, 4, 4} B. {5, 10, 4, 11, 12, 13, 12, 13, 12, 11, 14, 14, 19, 18} C. {5, 6, 5, 11, 12, 13, 12, 13, 14, 15, 11, 18, 17, 13} D. {3, 5, 10, 11, 13, 7, 18, 14, 4}arrow_forwardHow wide is the chasm between what men and women earn in the workplace? According to a 2015 analysis from a national women's group, women lose $435,049 over the course of a career because of the pay gap. The bar graph to the right shows the average earnings in the United States for men and women at ages 22 and 55. This exercise involves the graphs of models for the data shown in the rectangular coordinate system to the right. Complete parts (a) through (c) below. BEEB Average Yearly Earnings in the U.S., by Gender and Age M(age=33)=$thousand (Type an integer or decimal rounded to one decimal place as needed.) Average Yearly Earnings ($1000s) 70- 60- Men 50-Women- 40- 30- 20- 10- 0- 22 Age 55 Average Yearly Earnings ($1000s) A $70 (3087) $60- $30 $20- $10- $0 } e $50 (0.23) $40 BN 9 ST (Use integers or decimals for any numbers in the expression. Round to two decimal places as needed.) b. Use the two points for women shown on the graph to find a function in the form W(x) = mx + b that…arrow_forward. Marriage Rate The marriage rate per 1000 unmarriedwomen for the years 1987–2014 can be modeled bythe function 132x + 1000y = 9570, where x is thenumber of years after 1980. During what year doesthe equation indicate the marriage rate will be 4.29?(Source: National Vital Statistics Report 2010)arrow_forward
- The U.S. Geological Survey monitors and reports on earthquakes, providing daily real-time, worldwide earthquake lists. Some of the information for four of the 105 earthquakes of magnitude 1.5 or greater that occurred on May 10, 2013, is shown in the following table. Magnitude is given on the Richter scale and NST stands for the number of stations that reported the activity on the same earthquake. Complete parts (a) through (e) below. Time Magnitude Depth (km) NST Region 00:03:16 1.7 75.9 29 Alaska 04:59:11 1.7 134.9 18 Alaska 08:27:04 2.8 64.0 21 Alaska 23:30:09 4.2 10.0 34 China a. Identify the type of data provided by the information in the first column of the table. Also identify the variable under consideration. Quantitative, Continuous, Qualitative, Quantitative, Discrete, region where the earthquake occurred depth of the earthquake in kilometers number of stations reporting the earthquake…arrow_forwardHow wide is the chasm between what men and women earn in the workplace? According to a 2015 analysis from a national women's group, women lose $435,049 over the course of a career because of the pay gap. The bar graph to the right shows the average earnings in the United States for men and women at ages 22 and 60. This exercise involves the graphs of models for the data shown in the rectangular coordinate system to the right. Complete parts (a) through (c) below. Average Yearly Earnings ($1000s) Average Yearly Earnings in the U.S., by Gender and Age 70- 60- ■Men 50 Women 40- 30- 20- 10- 0- 22 Age 60 Average Yearly Earnings ($1000s) $70- $60- (30,67).. $50 (0,24) $40+ $30+ $20- $10- $0+ 0 M(age=38) = $ thousand (Type an integer or decimal rounded to one decimal place as needed.) ♦ (0,21) Men *(30,40) Women 10 20 30 40 50 Years after Age 22 --X7 (Use integers or decimals for any numbers in the expression. Round to two decimal places as needed.) b. Use the two points for women shown on…arrow_forwardThe figure below shows a plot of Healthcare Expenditure per capita in 2019 and Life Expectancy according to data sourced from the World Bank with regions around the world being colour-coded (e.g. Australia, which is in Oceania, has health expenditure per capita of $5,427 and life expectancy of 83.2 years). In no more than 200 words, describe the patterns that you see in this figure.arrow_forward
- Hi i’m in grade 12 Data Management and i need help with this practice questionarrow_forward#32 Survey: Customer Loyalty Are customers more loyal in the east or in the west? The following table is based on information from Trends in the United States. The columns represent length of customer loyalty (in years) at a primary supermarket. The rows represent regions on the United States.arrow_forwardTABLE 1.5 The amount of money expended in fiscal year 2009 by the U.S. Department of Defense in various categories is shown in Table 1.5.5 Construct both a pie chart and a bar chart to describe the data. Compare the two forms of presentation. Expenses by Category Category Amount ($ billions) Military personnel 147.3 Operation and maintenance 259.3 Procurement 129.2 Research and development 79.0 Military construction 17.6 Other 4.3 Total 636.7 Source: The World Almanac and Book of Facts 2011arrow_forward
 Trigonometry (MindTap Course List)TrigonometryISBN:9781337278461Author:Ron LarsonPublisher:Cengage Learning
 Holt Mcdougal Larson Pre-algebra: Student Edition...AlgebraISBN:9780547587776Author:HOLT MCDOUGALPublisher:HOLT MCDOUGAL
 Glencoe Algebra 1, Student Edition, 9780079039897...AlgebraISBN:9780079039897Author:CarterPublisher:McGraw Hill