
Videos
The following data are from a repeated-measures study examining the effect of a treatment by measuring a group of n = 9 participants before and after they receive the treatment.
a. Calculate the difference scores and MD.
b. Compute SS, sample variance, and estimated standard error.
c. Is there a significant treatment effect? Use α = .05, two tails.
| Participant | Before Treatment | After Treatment |
| A | 8 | 7 |
| B | 7 | 5 |
| C | 6 | 6 |
| D | 7 | 6 |
| E | 9 | 7 |
| F | 8 | 5 |
| G | 5 | 4 |
| H | 9 | 4 |
| I | 7 | 4 |
a.
Difference scores and
Answer to Problem 7P
Difference scores obtained are
Explanation of Solution
Given info:
Scores of
| Participant | Before Treatment | After Treatment |
| A | 8 | 7 |
| B | 7 | 5 |
| C | 6 | 6 |
| D | 7 | 6 |
| E | 9 | 7 |
| F | 8 | 5 |
| G | 5 | 4 |
| H | 9 | 4 |
| I | 7 | 4 |
Calculation:
Difference of scores are given by the subtracting the scores before different treatment from the scores after treatment.
Step-by-step procedure to obtain the difference scores using the SPSS software is.
- Enter the name of four variables in variable view>Participants, Before_Treatment, After_Treatment, and Difference.
- Enter the values of given variables.
- Go to Transform>Choose Compute variable>Write Difference in Target Variable.
- Choose variable After_Treatment and move it to numeric expression> Choose
- Choose OK.
- Choose Yes.
Output using the SPSS software is given below:
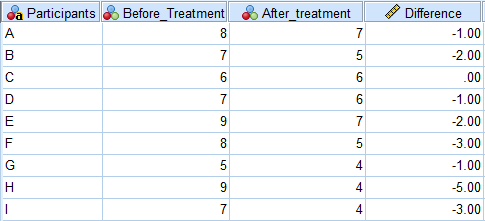
From the SPSS output difference scores are
Step-by-step procedure to obtain the
- Choose Analyze > Descriptive Statistics> choose Descriptive.
- Select Difference and move it under variable(s)>Choose Options>Select Mean.
- Choose Continue> choose OK.
Output using the SPSS software is given below:
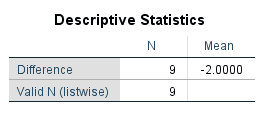
From the SPSS output,
b.
Difference scores are and
Answer to Problem 7P
The value of SS, variance and standard error obtained are 18, 2.25 and 0.5 respectively.
Explanation of Solution
Calculation:
Difference of scores are given by the subtracting the scores before different treatment from the scores after treatment.
Step-by-step procedure to obtain the difference scores using the SPSS software is.
- Enter the name of four variables in variable view>Participants, Before_Treatment, After_Treatment, and Difference.
- Enter the values of given variables.
- Go to Transform>Choose Compute variable>Write Difference in Target Variable.
- Choose variable After_Treatment and move it to numeric expression> Choose
- Choose OK.
- Choose Yes.
Output using the SPSS software is given below:
From the SPSS output difference scores are
Step-by-step procedure to obtain the variance using the SPSS software:
- Choose Analyze > Descriptive Statistics> choose Descriptive.
- Select Difference and move it under variable(s)>Choose Options>Select Variance.
- Choose Continue> choose OK.
Output using the SPSS software is given below:
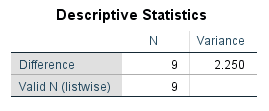
From the SPSS output variance is 2.25.
Let
Then SS is given as:
Step-by-step procedure to obtain the standard error using the SPSS software:
- Choose Analyze > Descriptive Statistics> choose Descriptive.
- Select Difference and move it under variable(s)>Choose Options>Select S.E. mean.
- Choose Continue> choose OK.
Output using the SPSS software is given below:
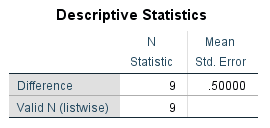
From the SPSS standard error is 0.5.
Thus, the value of SS, variance and standard error obtained are 18, 2.25 and 0.5 respectively.
c.
Treatment has a significant effect.
Answer to Problem 7P
Treatment has significant effect on the participants.
Explanation of Solution
Calculation:
State the hypotheses:
Null Hypothesis:
That is, the treatment does not have a significant effect on the participants.
Alternate Hypothesis:
That is, the treatment has a significant effect on the participants.
Step-by-step procedure to obtain the p value for given test using the SPSS software:
- Choose Analyze > Compare means> choose Paired Samples T test.
- Select Before_treatment and move it under variable1> Select After_treatment and move it under variable2.
- Choose OK.
Output using the SPSS software is given below:
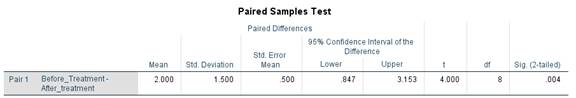
From the SPSS output t statistic and p value obtained are 4 and 0.004 respectively.
Since p value obtained is less than level of significance
Conclusion:
The treatment has significant effect on participants.
Want to see more full solutions like this?
Chapter 11 Solutions
Essentials of Statistics for The Behavioral Sciences (MindTap Course List)


 Glencoe Algebra 1, Student Edition, 9780079039897...AlgebraISBN:9780079039897Author:CarterPublisher:McGraw Hill