
Videos
As part of a study to determine the effects of allowing the use of credit cards for alcohol purchases in Canada (“Changes in Alcohol Consumption Patterns Following the Introduction of Credit Cards in Ontario Liquor Stores,” Journal of Studies on Alcohol [1999]: 378–382), randomly selected individuals were given a questionnaire asking them how many drinks they had consumed during the previous week. A year later (after liquor stores started accepting credit cards for purchases), these same individuals were again asked how many drinks they had consumed in the previous week. The values in the accompanying table are consistent with summary values presented in the article.
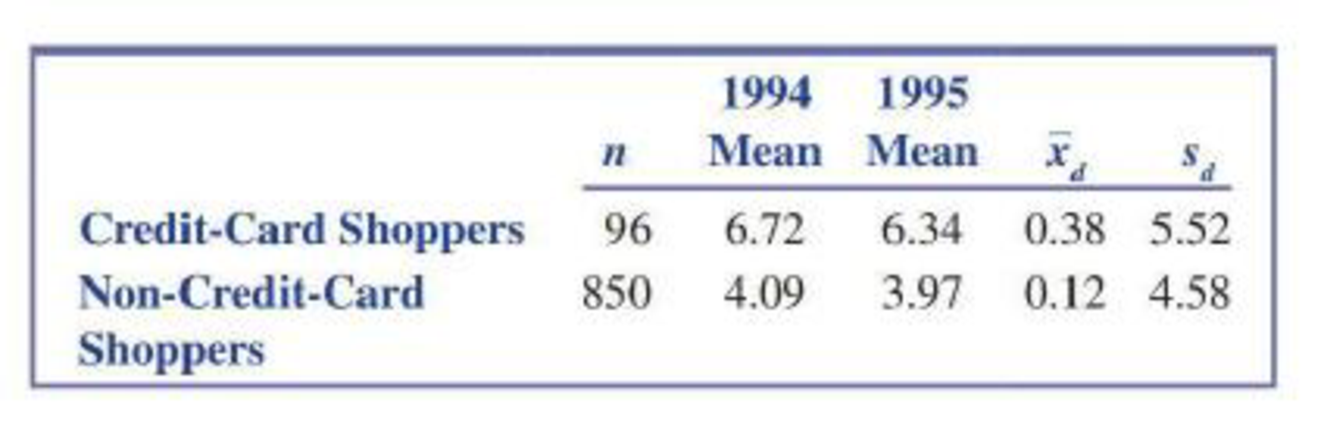
- a. The standard deviations of the differences were quite large. Explain how this could be the case.
- b. Calculate a 95% confidence interval for the mean difference in drink consumption for credit-card shoppers between 1994 and 1995. Is there evidence that the mean number of drinks decreased?
- c. Test the hypothesis that there was no change in the mean number of drinks between 1994 and 1995 for the non-credit-card shoppers. Be sure to calculate and interpret the P-value for this test.

Trending nowThis is a popular solution!

Chapter 11 Solutions
Introduction To Statistics And Data Analysis


- A study in Sweden looked at former elite soccer players, people who had played soccer but not at the elite level, and people of the same age who did not play soccer. Here is a two-way table that classifies these subjects by whether or not they had arthritis of the hip or knee by their mid-fifties: Elite Non-elite Did not play Arthritis 10 9 24 No arthritis 61 206 548 Based on this study, you can conclude thatarrow_forwardIn a study of whether taking a garlic supplement reduces the risk of getting a cold, participants were assigned to either a garlic supplement group or to a group that did not take a garlic supplement.† Based on the study, it was concluded that the proportion of people taking a garlic supplement who get a cold is lower than the proportion of those not taking a garlic supplement who get a cold. Do you think that the study was conducted in a reasonable way? What additional information would you want in order to evaluate this study? (Select all that apply.) A) whether the patients knew which treatment they were receiving B) whether the patients were randomly assigned to the treatments C) whether the patient's last name started with A through M D) whether the patient's cold lasted more than a week E) whether the experiment was conducted on a sufficient number of patients so that the differences observed could not be attributed to chancearrow_forwardA study of “adverse symptoms” in users of over-the-counter pain relief medications assigned subjects at random toone of two common pain relievers: acetaminophen and ibuprofen. In all, 650 subjects took acetaminophen, and 44experienced some adverse symptom. Of the 347 subjects who took ibuprofen, 49 had an adverse symptom. Is thisconvincing evidence that the two pain relievers differ in the proportion of people who experience an adverse symptom?arrow_forward
- The following data are taken from an experiment in which the subjects were tested for motion sickness. Thesubjects were randomly assigned to either the control group which was given a placebo or the experimentalgroup which was given the drug Astemizole and observed on an ocean voyage. The same subjects were thenswitched and those that had the placebo were now given the drug, and those that had the drug were nowgiven a placebo and observed on a new ocean voyage taking the same course. The results are the number ofhead movements that the subjects could endure without becoming nauseous. Use α = 0.05 to test the claimthat Astemizole is effective, i.e. it takes a larger number of head movements before the subject getsnauseous.Control 19 45 36 42 38 31 30 40 41 35Drug 20 55 36 45 40 32 41 38 44 29 1) State the hypotheses and identify the claim. Group 1 is the Control group. 2)Find the test statistic and Find the p-value. 3)Make the decision and Summarize the results.arrow_forwardIn a study designed to test the effectiveness of hypnosis in reducing pain a research team looked at responses from 8 randomly selected patients before and after hypnosis. The raw data are found in Table 1. Let ? = 0.01 Table 1: Perceived pain levels pre and post hypnosis for 8 subjects Pre 9.6 11.3 10.6 8.5 9.8 12.8 10.8 12.2 Post 9.3 11.0 8.5 10.0 10.2 9.4 8.9 11.5 Diff -0.3 -0.3 -2.1 1.5 0.4 -3.4 -1.9 -0.7 E) The point estimate for the true standard deviation of the effect that hypnosis has on pain perception is: Note: round your answer to 3 decimal precision G) The test statistic for this data set is: Note: Round your answer to the nearest hundredth.arrow_forwardIn a study of the effectiveness of a new device that supports a weak or damaged heart, 150 people who consented to treatment were assigned at random to either a standard treatment consisting of drugs or the experimental treatment that consisted of drugs and surgery to install the new device. After two years, 60% of the 67 patients who received the device had improved and 40% of the patients who received the standard treatment had improved. Does this data provide convincing evidence that the proportion of patients who recieved the experimental treatment who improved is higher than for the patients who received the standard treatment? Test the relevant hypotheses using a significance level of 0.05. (Use pexperimental − pstandard ).A) State the null and alternative hypotheses. H0: pe − ps = 0, HA: pe − ps ≠ 0 H0: pe − ps = 0, HA: pe − ps < 0 H0: pe − ps = 0, HA: pe − ps > 0 B) Find the test statistic.z = C) What is the p-value?P-Value = D) State your conclusion in terms of…arrow_forward
- Do cell phones increase drivers' reaction times while driving? A 2003 American Journal of Health Education study investigated the effects of cell phone use on reaction time. In the study, 60 participants were randomly selected and placed into one of two groups: the cell phone group or the control group. Those in the control group participated in the experiment with no distractions, whereas those in the cell phone group had access to text documents on a cell phone. Participants in each group were then asked to take a computerized reaction time test. Researchers then recorded each subject's reaction time in seconds. The table shows the results of the experiment. Group Populationmean Samplesize Samplemean Sample standarddeviation Phone up n=30 x¯P=0.546 sx=0.213 Control uc n=30 x¯C=0.356 sx=0.245 df=56.900 Suppose the researchers wish to examine at a significance level of alpha=0.05 if the mean reaction time for phone users is larger than the mean reaction time for the…arrow_forwardA researcher conducted a medical study to investigate whether taking a low-dose aspirin reduces the chance of developing colon cancer. As part of the study, 1,000 adult volunteers were randomly assigned to one of two groups. Half of the volunteers were assigned to the experimental group that took a low-dose aspirin each day, and the other half were assigned to the control group that took a placebo each day. At the end of six years, 15 of the people who took the low-dose aspirin had developed colon cancer and 26 of the people who took the placebo had developed colon cancer. At the significance level α = 0.05, do the data provide convincing statistical evidence that taking a low-dose aspirin each day would reduce the chance of developing colon cancer among all people similar to the volunteers?arrow_forwardA low-level CDC bureaucrat wants to please his boss by gathering evidence thatthe current government-mandated shutdown of society is not causing people’s mentalhealth to deteriorate, so that it can safely be continued for several years if anyexpert says it’s necessary.He polls a random sample of 1600 citizens, gathering data on such items asincome loss, weight gain, access to toilet paper, hours spent binge-watchingNetflix, and number of injuries caused by household fights, and compiles all thisinto a scientifically-weighted “misery index”.The mean misery index from the sample is 99.2; it seems reasonable to use apopulation standard deviation σ = 19.1.a) Does this information provide significant evidence (at the 5% level) that thenationwide mean misery index is less than 100? Set up appropriate null andalternative hypotheses, calculate the appropriate test statistic, find the P-value,and state your conclusion. (10)b) A CDC press release publishing the results of this study claims that…arrow_forward
- A low-level CDC bureaucrat wants to please his boss by gathering evidence thatthe current government-mandated shutdown of society is not causing people’s mentalhealth to deteriorate, so that it can safely be continued for several years if anyexpert says it’s necessary.He polls a random sample of 1600 citizens, gathering data on such items asincome loss, weight gain, access to toilet paper, hours spent binge-watchingNetflix, and number of injuries caused by household fights, and compiles all thisinto a scientifically-weighted “misery index”.The mean misery index from the sample is 99.2; it seems reasonable to use apopulation standard deviation σ = 19.1.a) Does this information provide significant evidence (at the 5% level) that thenationwide mean misery index is less than 100? Set up appropriate null andalternative hypotheses, calculate the appropriate test statistic, find the P-value,and state your conclusion. b) A CDC press release publishing the results of this study claims that…arrow_forwardIn one study subjects were randomly assigned to receive either 500 milligrams of vitamin C daily or a placebo, and the number of colds they came down with during a winter season was noted. In the second study people responded to a questionnaire asking about the average number of hours they sleep per night and the number of colds they came down with during a winter season. a. The first study was an observational study, while the second was a controlled experiment. b. The first study was a controlled experiment, while the second was an observational study. c. Both studies were controlled experiments. d. Both studies were observational studies.arrow_forwardIn a study of a group of women science majors who remained in their profession and a group who left their profession within a few months of graduation, the researchers collected the data shown here on a self-esteem questionnaire. Leavers Stayers1 = 3.05 2 = 2.92σ1 = 0.71 σ2 = 0.71n1 = 100 n2 = 227At α = 0.05, can it be concluded that there is a difference in the self-esteem scores of the two groups? Use the P-value method.arrow_forward
 Holt Mcdougal Larson Pre-algebra: Student Edition...AlgebraISBN:9780547587776Author:HOLT MCDOUGALPublisher:HOLT MCDOUGAL