
Videos
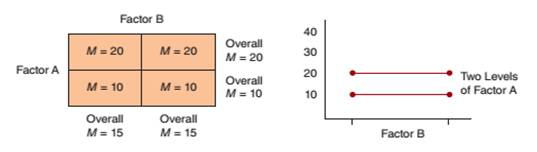
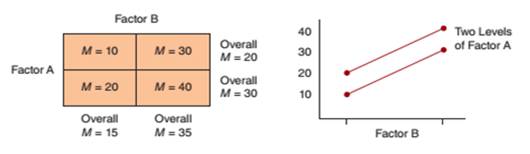
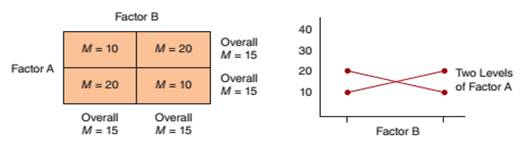
In Figure 11.5, we show three combinations of main effects and interactions for a 2 × 2 factorial design. Using the same 2 × 2 structure, with factor A defining the rows and factor B defining the columns, create a set of means that produce each of the following patterns:
a. A main effect for factors A and B, but no interaction.
b. A main effect for factor A and an interaction, but no main effect for factor B.
c. A main effect for both factors and an interaction.
FIGURE 11.5
Three Possible Combinations of Main Effects and Interactions in a Two-Factor Experiment.
(a) Data showing a main effect for factor A but no main effect for factor B and no interaction.
(b) Data showing main effects for both factor A and factor B but no interaction.
(c) Data showing no main effect for either factor, but an interaction.

Trending nowThis is a popular solution!

Chapter 11 Solutions
Research Methods for the Behavioral Sciences (MindTap Course List)


- A dairy farmer thinks that the average weight gain of his cows depends on two factors: the type of grain that they are fed and the type of grass that they are fed. The dairy farmer has four different types of grain from which to choose and three different types of grass from which to choose. He would like to determine if there is a particular combination of grain and grass that would lead to the greatest weight gain on average for his cows. He randomly selects three one-year-old cows and assigns them to each of the possible combinations of grain and grass. After one year he records the weight gain for each cow (in pounds) with the following results. Is there sufficient evidence to conclude that there is a significant difference in the average weight gains among the cows for the different types of grain? Cow Weight Gain (Pounds) Grass A Grass B Grass B Grain A 359359 327327 232232 277277 250250 163163 191191 304304 216216 Grain B 331331 348348 176176 318318 205205…arrow_forwardA dairy farmer thinks that the average weight gain of his cows depends on two factors: the type of grain that they are fed and the type of grass that they are fed. The dairy farmer has four different types of grain from which to choose and three different types of grass from which to choose. He would like to determine if there is a particular combination of grain and grass that would lead to the greatest weight gain on average for his cows. He randomly selects three one-year-old cows and assigns them to each of the possible combinations of grain and grass. After one year he records the weight gain for each cow (in pounds) with the following results. Is there sufficient evidence to conclude that there is a significant difference in the average weight gains among the cows for the different types of grain? Cow Weight Gain (Pounds) Grass A Grass B Grass B Grain A 163163 287287 305305 267267 304304 325325 198198 348348 172172 Grain B 338338 291291 223223 286286 168168…arrow_forwardWhich of the following is a benefit of a within-groups design over a between-groups design?arrow_forward
- In an online psychology experiment sponsored by the University of Mississippi, researchers asked study participants to respond to various stimuli. Participants were randomly assigned to one of three treatment groups: Group 1, the simple group, required to respond as quickly as possible after a stimulus was presented; Group 2, the go/no-go group, required to respond to a particular stimulus while disregarding other stimuli; and Group 3, the choice group, required to respond differently depending on the stimuli presented. The researcher felt that age may be a factor in determining reaction time, so she organized the experimental units by age into an 18-24 year old group (1), a 25-34 year old group (2), and a 35 and older group (3). She obtained the data given in the “Psychology data” JMP file. a)How many treatments are there? b)What type of factorial design is this? How many replications are there within each cell?arrow_forwardIn factorial designs, the response produced when the treatments of one factor interact with the treatments of another in influencing the response variable is known as?arrow_forwardThe following table summarizes the results from a two-factor study with 2 levels of factor A and3 levels of factor B using a separate sample of n = 11 participants in each treatment condition.Fill in the missing values. (Hint: Start with the df values.)Source SS Df MSBetween treatments _____ _____Factor A _____ _____ _____ F = 7Factor B _____ _____ _____ F = 8A x B interaction _____ _____ _____ F = 3Within treatments 240 _____ _____Total _____ _____arrow_forward
- Cells B1, C1, and D1 contain the values Seat1Row1, Seat1Row2, and Seat1Row3. If cells B1, C1, and D1 were selected, and autofill used to fill E1, F1, and G1, what would be the autofilled values? a) Seat2Row3, Seat3Row3, Seat4Row3 b) Seat2Row4, Seat3Row5, Seat4Row6 c) Seat1Row4, Seat1Row5, Seat1Row6 d) Autofill cannot be used for these valuesarrow_forwardIn a factorial design, levels of an independent variable are what?arrow_forwardThe figure to the right shows the results of a survey in which 1012 adults from Country A, 1009 adults from Country B, 1016 adults from Country C, 1010 adults from Country D, and 1005 adults from Country E were asked whether national identity is strongly tied to birthplace. A table labeled "National Identity and Birthplace, People from different countries who believe national identity is strongly tied to birthplace" consists of five rows containing the following information from top to bottom, with row listed first and information listed second: Country A, 31 percent; Country B, 20 percent; Country C, 25 percent; Country D, 53 percent; Country E, 12 percent.Country A31%20%25%53%Country BCountry CCountry DCountry E12% Construct a 99% confidence interval for the population proportion of adults who say national identity is strongly tied to birthplace for each country listed.arrow_forward
- The following matrix presents the results from an independent-measures, two-factor study with a sample of n = 10 participants in each treatment condition. Note that one treatment mean is missing. B1 B2 A1 5 8 A2 3 A) What value for the missing mean would result in no main effect for factor A? B) What value for the missing mean would result in no main effect for factor B? C) What value for the missing mean would result in no interaction?arrow_forwardQUESTION 2 A research design where one group is tested in one conditions and another group is tested in another condition is called ______. a. matched-pair design b. between-subjects design c. twin study d. within-subjects designarrow_forwardCells B1, C1, and D1 contain the values Seat1Row1, Seat1Row2, and Seat1Row3. If cells B1, C1, and D1 were selected, and autofill used to fill E1, F1, and G1, what would be the autofilled values? a- seat2row3, seat3row3, sear4row3 b-seat2row4, seat3row5, seat4row6 c- seat1row4, seat1row5, seat1row6 d- autofill cannot be used for these optionsarrow_forward
 Linear Algebra: A Modern IntroductionAlgebraISBN:9781285463247Author:David PoolePublisher:Cengage Learning