The Practice of Statistics for AP - 4th Edition
4th Edition
ISBN: 9781429245593
Author: Starnes, Daren S., Yates, Daniel S., Moore, David S.
Publisher: Macmillan Higher Education
bartleby

Concept explainers

bartleby

Videos

Question
Book Icon
Chapter 1.1, Problem 9E

(a)

To determine

To find: the percent of vehicles which have colours other than the given.

(a)

Expert Solution
Check Mark

Answer to Problem 9E

There are 100% of vehicles had colours other than those listed.

Explanation of Solution

Given:

  The Practice of Statistics for AP - 4th Edition, Chapter 1.1, Problem 9E , additional homework tip  1

Calculation:

There are no vehicles colours other than those listed as the total percentage listed is 100%.
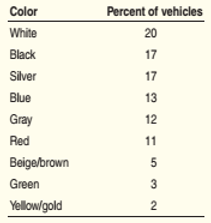
    Sl. No.ColourPercent of Vehicles
    1White20
    2Black17
    3Silver17
    4Blue13
    5Grey12
    6Red11
    7Beige/Brown5
    8Green3
    9Yellow/Golden2
    Total100

Conclusion:

Hence,there are 100% of vehicles had colours other than those listed.

(b)

To determine

To show: the given data in a bar graph.

(b)

Expert Solution
Check Mark

Answer to Problem 9E

The data below is displayed in a bar graph format.

  The Practice of Statistics for AP - 4th Edition, Chapter 1.1, Problem 9E , additional homework tip  2

Explanation of Solution

Calculation:

Bar graph is used to display the distribution of categorical variables more vividly. It represents each category as a bar. The height of the bar shows the category count or percentage.

The data is displayed in a bar graph format below:

  The Practice of Statistics for AP - 4th Edition, Chapter 1.1, Problem 9E , additional homework tip  3

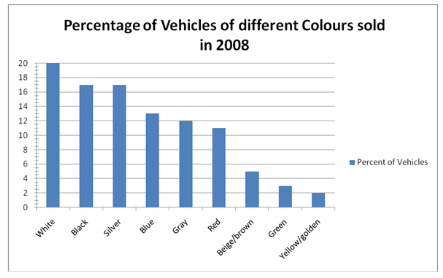
From the above graph can say that white is the most popular colour followed by black and silver.

Conclusion:

Therefore, the data above is displayed in a bar graph format.

(c)

To determine

To explain: whether the given data can be used to make a pie chart or not

(c)

Expert Solution
Check Mark

Answer to Problem 9E

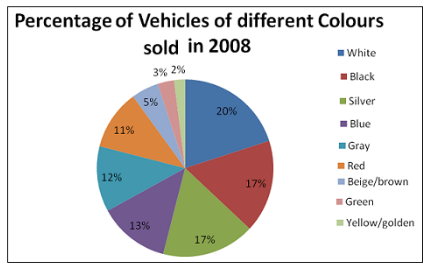
This is the pie chart of the given data.

  The Practice of Statistics for AP - 4th Edition, Chapter 1.1, Problem 9E , additional homework tip  4

Explanation of Solution

Calculation:

For the given data, it is appropriate to use “pie” chart. Here the given colours explain the 100% of vehicles, means no colour other than those listed are there thus we can draw a pie chart with the data.

  The Practice of Statistics for AP - 4th Edition, Chapter 1.1, Problem 9E , additional homework tip  5

Conclusion:

Therefore, the given data can be displayed as pie chart.

Chapter 1 Solutions

The Practice of Statistics for AP - 4th Edition

Ch. 1.1 - Prob. 16ECh. 1.1 - Prob. 17ECh. 1.1 - Prob. 18ECh. 1.1 - Prob. 19ECh. 1.1 - Prob. 20ECh. 1.1 - Prob. 21ECh. 1.1 - Prob. 22ECh. 1.1 - Prob. 23ECh. 1.1 - Prob. 24ECh. 1.1 - Prob. 25ECh. 1.1 - Prob. 26ECh. 1.1 - Prob. 27ECh. 1.1 - Prob. 28ECh. 1.1 - Prob. 29ECh. 1.1 - Prob. 30ECh. 1.1 - Prob. 31ECh. 1.1 - Prob. 32ECh. 1.1 - Prob. 33ECh. 1.1 - Prob. 34ECh. 1.1 - Prob. 35ECh. 1.1 - Prob. 36ECh. 1.2 - Prob. 1.1CYUCh. 1.2 - Prob. 1.2CYUCh. 1.2 - Prob. 1.3CYUCh. 1.2 - Prob. 1.4CYUCh. 1.2 - Prob. 2.1CYUCh. 1.2 - Prob. 2.2CYUCh. 1.2 - Prob. 2.3CYUCh. 1.2 - Prob. 2.4CYUCh. 1.2 - Prob. 3.1CYUCh. 1.2 - Prob. 3.2CYUCh. 1.2 - Prob. 4.1CYUCh. 1.2 - Prob. 4.2CYUCh. 1.2 - Prob. 4.3CYUCh. 1.2 - Prob. 4.4CYUCh. 1.2 - Prob. 37ECh. 1.2 - Prob. 38ECh. 1.2 - Prob. 39ECh. 1.2 - Prob. 40ECh. 1.2 - Prob. 41ECh. 1.2 - Prob. 42ECh. 1.2 - Prob. 43ECh. 1.2 - Prob. 44ECh. 1.2 - Prob. 45ECh. 1.2 - Prob. 46ECh. 1.2 - Prob. 47ECh. 1.2 - Prob. 48ECh. 1.2 - Prob. 49ECh. 1.2 - Prob. 50ECh. 1.2 - Prob. 51ECh. 1.2 - Prob. 52ECh. 1.2 - Prob. 53ECh. 1.2 - Prob. 54ECh. 1.2 - Prob. 55ECh. 1.2 - Prob. 56ECh. 1.2 - Prob. 57ECh. 1.2 - Prob. 58ECh. 1.2 - Prob. 59ECh. 1.2 - Prob. 60ECh. 1.2 - Prob. 61ECh. 1.2 - Prob. 62ECh. 1.2 - Prob. 63ECh. 1.2 - Prob. 64ECh. 1.2 - Prob. 65ECh. 1.2 - Prob. 66ECh. 1.2 - Prob. 67ECh. 1.2 - Prob. 68ECh. 1.2 - Prob. 69ECh. 1.2 - Prob. 70ECh. 1.2 - Prob. 71ECh. 1.2 - Prob. 72ECh. 1.2 - Prob. 73ECh. 1.2 - Prob. 74ECh. 1.2 - Prob. 75ECh. 1.2 - Prob. 76ECh. 1.2 - Prob. 77ECh. 1.2 - Prob. 78ECh. 1.3 - Prob. 1.1CYUCh. 1.3 - Prob. 1.2CYUCh. 1.3 - Prob. 1.3CYUCh. 1.3 - Prob. 1.4CYUCh. 1.3 - Prob. 2.1CYUCh. 1.3 - Prob. 2.2CYUCh. 1.3 - Prob. 2.3CYUCh. 1.3 - Prob. 2.4CYUCh. 1.3 - Prob. 3.1CYUCh. 1.3 - Prob. 3.2CYUCh. 1.3 - Prob. 3.3CYUCh. 1.3 - Prob. 3.4CYUCh. 1.3 - Prob. 79ECh. 1.3 - Prob. 80ECh. 1.3 - Prob. 81ECh. 1.3 - Prob. 82ECh. 1.3 - Prob. 83ECh. 1.3 - Prob. 84ECh. 1.3 - Prob. 85ECh. 1.3 - Prob. 86ECh. 1.3 - Prob. 87ECh. 1.3 - Prob. 88ECh. 1.3 - Prob. 89ECh. 1.3 - Prob. 90ECh. 1.3 - Prob. 91ECh. 1.3 - Prob. 92ECh. 1.3 - Prob. 93ECh. 1.3 - Prob. 94ECh. 1.3 - Prob. 95ECh. 1.3 - Prob. 96ECh. 1.3 - Prob. 97ECh. 1.3 - Prob. 98ECh. 1.3 - Prob. 99ECh. 1.3 - Prob. 100ECh. 1.3 - Prob. 101ECh. 1.3 - Prob. 102ECh. 1.3 - Prob. 103ECh. 1.3 - Prob. 104ECh. 1.3 - Prob. 105ECh. 1.3 - Prob. 106ECh. 1.3 - Prob. 107ECh. 1.3 - Prob. 108ECh. 1.3 - Prob. 109ECh. 1.3 - Prob. 110ECh. 1.3 - Prob. 111ECh. 1.3 - Prob. 112ECh. 1.3 - Prob. 113ECh. 1 - Prob. 1CYUCh. 1 - Prob. 2CYUCh. 1 - Prob. 1ECh. 1 - Prob. 2ECh. 1 - Prob. 3ECh. 1 - Prob. 4ECh. 1 - Prob. 5ECh. 1 - Prob. 6ECh. 1 - Prob. 7ECh. 1 - Prob. 8ECh. 1 - Prob. 1CRECh. 1 - Prob. 2CRECh. 1 - Prob. 3CRECh. 1 - Prob. 4CRECh. 1 - Prob. 5CRECh. 1 - Prob. 6CRECh. 1 - Prob. 7CRECh. 1 - Prob. 8CRECh. 1 - Prob. 9CRECh. 1 - Prob. 10CRECh. 1 - Prob. 1PTCh. 1 - Prob. 2PTCh. 1 - Prob. 3PTCh. 1 - Prob. 4PTCh. 1 - Prob. 5PTCh. 1 - Prob. 6PTCh. 1 - Prob. 7PTCh. 1 - Prob. 8PTCh. 1 - Prob. 9PTCh. 1 - Prob. 10PTCh. 1 - Prob. 11PTCh. 1 - Prob. 12PTCh. 1 - Prob. 13PTCh. 1 - Prob. 14PTCh. 1 - Prob. 15PT
Knowledge Booster
Background pattern image
Statistics
Learn more about
Need a deep-dive on the concept behind this application? Look no further. Learn more about this topic, statistics and related others by exploring similar questions and additional content below.
Recommended textbooks for you
Text book image
MATLAB: An Introduction with Applications
Statistics
ISBN:9781119256830
Author:Amos Gilat
Publisher:John Wiley & Sons Inc
Text book image
Probability and Statistics for Engineering and th...
Statistics
ISBN:9781305251809
Author:Jay L. Devore
Publisher:Cengage Learning
Text book image
Statistics for The Behavioral Sciences (MindTap C...
Statistics
ISBN:9781305504912
Author:Frederick J Gravetter, Larry B. Wallnau
Publisher:Cengage Learning
Text book image
Elementary Statistics: Picturing the World (7th E...
Statistics
ISBN:9780134683416
Author:Ron Larson, Betsy Farber
Publisher:PEARSON
Text book image
The Basic Practice of Statistics
Statistics
ISBN:9781319042578
Author:David S. Moore, William I. Notz, Michael A. Fligner
Publisher:W. H. Freeman
Text book image
Introduction to the Practice of Statistics
Statistics
ISBN:9781319013387
Author:David S. Moore, George P. McCabe, Bruce A. Craig
Publisher:W. H. Freeman
Continuous Probability Distributions - Basic Introduction; Author: The Organic Chemistry Tutor;https://www.youtube.com/watch?v=QxqxdQ_g2uw;License: Standard YouTube License, CC-BY
Probability Density Function (p.d.f.) Finding k (Part 1) | ExamSolutions; Author: ExamSolutions;https://www.youtube.com/watch?v=RsuS2ehsTDM;License: Standard YouTube License, CC-BY
Find the value of k so that the Function is a Probability Density Function; Author: The Math Sorcerer;https://www.youtube.com/watch?v=QqoCZWrVnbA;License: Standard Youtube License