
Videos
Fumonisins are environmental toxins produced by a type of mold and have been found in corn and in products made from raw corn. The Center for Food Safety and Applied Nutrition provided recommendations on allowable fumonisin levels in human food and in animal feed based on a study of corn meal. The study compared corn meal made from partially degermed corn (corn that has had the germ, the part of the kernel located at the bottom center of the kernel that is used to produce corn oil, partially removed) and corn meal made from corn that has not been degermed. Specimens of corn meal were analyzed and the total fumonisin level (ppm) was determined for each specimen. Summary statistics for total fumonisin level from the U.S. Food and Drug Administration’s web site are given here.
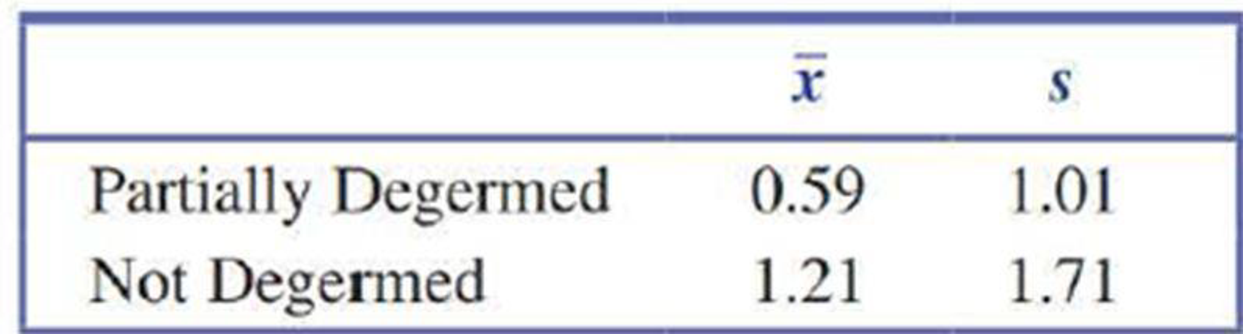
- a. If the given means and standard deviations had been based on a random sample of 10 partially degermed specimens and a random sample of 10 specimens made from com that was not degermed, explain why it would not be appropriate to carry out a two-sample t test to determine if there is a significant difference in the mean fumonisin level for the two types of corn meal.
- b. Suppose instead that each of the random samples had included 50 com meal specimens. Explain why it would now be reasonable to carry out a two-sample t test.
- c. Assuming that each random
sample size was 50, carry out a test to determine if there is a significant difference in mean fumonisin level for the two types of com meal. Use a significance level of 0.01.

Trending nowThis is a popular solution!

Chapter 11 Solutions
Introduction To Statistics And Data Analysis


- Define the critical region for a hypothesis test, and explain how the critical region is related to the alpha level.arrow_forwardYou are using a z-test to test H0: u=400 vs Ha: u<400 at the a=.05 level. What would the rejection region be for this test?arrow_forwardIn immune.xlsx, some individuals received a treatment of carotenoids (CAROT) and some received no treatment (NO). Carotenoids belong to a class of molecules called isoprenoids, many of them are antioxidants and some of them are vitamins such as vitamin A and its precursor beta-carotene, which is found in carrots. Because of the antioxidant properties of carotenoids the purpose of the study was to check if they have any effect on immunity. The column PHA gives quantitative measuremenst of cell-mediated immunity and the column SRBC gives quantitative measurements of humoral immunity. This is clearly a two-sample (non-paired) design. Therefore, you need to perform a Mann-Whitney-U test to check for differences. Bear in minds that rank assignments in Excel can be quite tricky and, therefore, if you need to do a Mann-Whitney rank assignment it is probably best to do this by hand. 1) What is the rank sum of the PHA data of the individuals, which received carotenoids and what is the…arrow_forward
- In immune.xlsx, some individuals received a treatment of carotenoids (CAROT) and some received no treatment (NO). Carotenoids belong to a class of molecules called isoprenoids, many of them are antioxidants and some of them are vitamins such as vitamin A and its precursor beta-carotene, which is found in carrots. Because of the antioxidant properties of carotenoids the purpose of the study was to check if they have any effect on immunity. The column PHA gives quantitative measuremenst of cell-mediated immunity and the column SRBC gives quantitative measurements of humoral immunity. This is clearly a two-sample (non-paired) design. Therefore, you need to perform a Mann-Whitney-U test to check for differences. Bear in minds that rank assignments in Excel can be quite tricky and, therefore, if you need to do a Mann-Whitney rank assignment it is probably best to do this by hand. 1) What is the rank sum of the SRBC data of the individuals, which received carotenoids and rank sum of…arrow_forwardResearch done at the Harvard School of Public Health showed that regular soda drinkers may have a tendency toward the weak and brittle bones associated with osteoporosis. They surveyed 2,622 women who were active athletes in college and classified them as to whether they regularly drank soft drinks or rarely drank soft drinks. The proportion of women in each group who suffered from bone fractures was determined. The findings: those who regularly drank soft drinks were twice as likely to suffer from bone fractures as those who rarely drank soft drinks. Source: Health and Fitness News Service, August 21, 1996. a. Was this an observational study or an experiment? Explain.b. What is the population under study?c. What was the explanatory variable?d. What was the response variable?e. What are some possible confounding variables in this study?arrow_forwardDuring the spring of 1999, many fuel storage facilities in Serbia were destroyed by bombing. As a result, significant quantities of oil products were spilled and burned,resulting in soil pollution. The article “Mobility of Heavy Metals Originating from Bombing of Industrial Sites” (B. Škrbić, J. Novaković, and N. Miljević, Journal of Environmental Science and Health, 2002:7–16) reports measurements of heavy metal concentrations at several industrial sites in June 1999, just after the bombing, and again in March of 2000. At the Smederevo site, on the banks of the Danube River, eight soil specimens taken in 1999 had an average lead concentration (in mg/kg) of 10.7 with a standard deviation of 3.3. Four specimens taken in 2000 had an average lead concentration of 33.8 with a standard deviation of 0.50. Find a 95% confidence interval for the increase in lead concentration between June 1999 and March 2000.arrow_forward
- Determine the kurtosis if the data given is a sample.arrow_forwardA survey of high school students was done to examine whether students had ever driven a car after consuming a substantial amount of alcohol (1=yes, 0=no). Data was collected on their sex (male/female), race (White/non-White), and grade level (9,10,11,12). Researchers realized that the impact of race on consuming alcohol before driving might vary by grade level and decided to fit the following model. Compute the OR of drinking before driving for students who self-reported as Black versus non-Black in the 9th grade, adjusting for gender. Hello, thank you for helping me out with this. I'm just confused about the concept of adjusting for gender in this case. I am not sure if I should plug in 0 and 1 for the gender and report those out separately or if I should take both odds ratios and divide them?arrow_forwardResearchers at a medical school want to compare the rates of birth defects in babies born to mothers with low-fat diets with those born to mothers with high-fat diets. For one year, they collected data on all babies and their mothers in area hospitals, using information obtained from the mothers to determine whether they fall in the low fat or high fat diet category.A) Observational B) Experimentalarrow_forward
- Do the data support the hypothesis that oligofructose facilitates calcium obsorption? What is the test statistic? Do the data support the hypothesis that oligofructose facilitates calcium obsorption? What is the degrees of freedom of the test?arrow_forwardThe authors of the paper "Dynamics of Canopy Structure and Light Interception in Pinus elliottii, North Florida" (Ecological Monographs (1991):33-51) planned an experiment to determine the effect of fertilizer on a measure of leaf area. A number of plots were available for the study, and half were selected at random to be fertilized. In order to assure that the plots to receive the fertilizer and the control plots were similar, prior to beginning the experiment tree density (the number of trees per hectare) was recorded for six plots to be fertilized and six control plots, resulting in the given data. Do the plots differ in tree number? Do you have any concerns about their experimental design? Fertilizer plots 1320 1216 1312 1280 1216 1312 control plots 1104 1072 1088 1150 1272 1280arrow_forwardIn recent years, concerns have been expressed about adverse health effects from amalgam dental restorations, which include mercury. The table below shows results from a study in which some patients were treated with amalgam restorations and others were treated with composite restorations that do not contain mercury (based on data from “Neuropsychological and Renal Effects of Dental Amalgam in Children,” by Bellinger, et al., Journal of the American Medical Association, Vol. 295, No. 15). Use a 0.05 significance level to test for independence between the type of restoration and sensory disorders. Do amalgam restorations appear to affect sensory disorders? Amalgam Composite Sensory disorder 36 28 No sensory disorder 231 239arrow_forward
 MATLAB: An Introduction with ApplicationsStatisticsISBN:9781119256830Author:Amos GilatPublisher:John Wiley & Sons Inc
 Probability and Statistics for Engineering and th...StatisticsISBN:9781305251809Author:Jay L. DevorePublisher:Cengage Learning
 Statistics for The Behavioral Sciences (MindTap C...StatisticsISBN:9781305504912Author:Frederick J Gravetter, Larry B. WallnauPublisher:Cengage Learning
 Elementary Statistics: Picturing the World (7th E...StatisticsISBN:9780134683416Author:Ron Larson, Betsy FarberPublisher:PEARSON
 The Basic Practice of StatisticsStatisticsISBN:9781319042578Author:David S. Moore, William I. Notz, Michael A. FlignerPublisher:W. H. Freeman
 Introduction to the Practice of StatisticsStatisticsISBN:9781319013387Author:David S. Moore, George P. McCabe, Bruce A. CraigPublisher:W. H. Freeman