
Algebra: Structure And Method, Book 1
(REV)00th Edition
ISBN:9780395977224
Author:Richard G. Brown, Mary P. Dolciani, Robert H. Sorgenfrey, William L. Cole
Publisher:Richard G. Brown, Mary P. Dolciani, Robert H. Sorgenfrey, William L. Cole
Chapter2: Working With Real Numbers
Section2.3: Rules For Addition
Problem 14WE

Related questions

Question
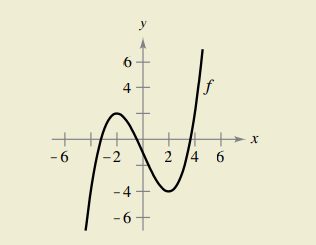
The graph of f is shown in the figure.(a) For which values of x is f′(x) zero? Positive? Negative? What do these values mean? (b) For which values of x is f ″(x) zero? Positive? Negative? What do these values mean? (c) On what open interval is f′ an increasing function? (d) For which value of x is f′(x) minimum? For this value of x, how does the rate of change of f compare with the rates of change of f for other values of x? Explain.
Transcribed Image Text:y
f
4
- 6
-2
2 14 6
-4
-67
Expert Solution
This question has been solved!
Explore an expertly crafted, step-by-step solution for a thorough understanding of key concepts.

This is a popular solution!

Trending now
This is a popular solution!

Step by step
Solved in 2 steps with 2 images

Knowledge Booster


Learn more about
Need a deep-dive on the concept behind this application? Look no further. Learn more about this topic, calculus and related others by exploring similar questions and additional content below.Recommended textbooks for you
Algebra: Structure And Method, Book 1
Algebra
ISBN:
9780395977224
Author:
Richard G. Brown, Mary P. Dolciani, Robert H. Sorgenfrey, William L. Cole
Publisher:
McDougal Littell

Elementary Algebra
Algebra
ISBN:
9780998625713
Author:
Lynn Marecek, MaryAnne Anthony-Smith
Publisher:
OpenStax - Rice University

Holt Mcdougal Larson Pre-algebra: Student Edition…
Algebra
ISBN:
9780547587776
Author:
HOLT MCDOUGAL
Publisher:
HOLT MCDOUGAL
Algebra: Structure And Method, Book 1
Algebra
ISBN:
9780395977224
Author:
Richard G. Brown, Mary P. Dolciani, Robert H. Sorgenfrey, William L. Cole
Publisher:
McDougal Littell
Elementary Algebra
Algebra
ISBN:
9780998625713
Author:
Lynn Marecek, MaryAnne Anthony-Smith
Publisher:
OpenStax - Rice University
Holt Mcdougal Larson Pre-algebra: Student Edition…
Algebra
ISBN:
9780547587776
Author:
HOLT MCDOUGAL
Publisher:
HOLT MCDOUGAL

