
Videos
In each of Exercises 11.33–11.36, use the technology of your choice to decide whether applying one-standard-deviation χ2-procedures appears reasonable. Explain your answers.
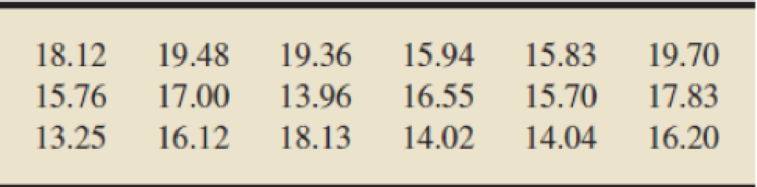
11.36 Plesiadapis cookei. One extinct relative of primates that lived in North America about 60 million years ago is called Plesiadapis cookei. Dental characteristics of P cookei were compared to those of other primate species in the article ‘‘Evidence of Dietary Differentiation among Late Paleocene-Early Eocene Plesiadapids" (American Journal of Physical Anthropology, Vol. 142, No. 2, pp. 194–210) by D. Boyer el al. The following table gives the dentary depth, in millimeters, for a sample of molars from the skulls of 18 P cookei specimens.
Want to see the full answer?
Check out a sample textbook solution
Chapter 11 Solutions
Introductory Statistics, Books a la Carte Plus NEW MyLab Statistics with Pearson eText -- Access Card Package (10th Edition)


- Recent results suggest that children with ADHD tend to watch more TV than children who are not diagnosed with the disorder. To examine this relationship, a researcher obtains a random sample of n = 36 children, 8 to 12 years old, who have been diagnosed with ADHD. Each child is asked to keep a journal recording how much time each day is spent watching TV. The average daily time for the sample is M = 4.9 hours. It is known that the average time for the general population of 8 to 12-year-old children is = 4.1 hours with = 1.8. (Hint: Be sure to use the correct test statistic). Are the data sufficient to conclude that children with ADHD watch significantly more TV than children without the disorder? Use a two-tailed test with = .05. (Be sure to give your conclusion, too) If the researcher had used a sample of n = 9 children and obtained the same sample mean, would the results be sufficient to reject H0? (Be sure to give your conclusion, too) Compute Cohen's d for this study. What is…arrow_forwardRecent results suggest that children with ADHD tend to watch more TV than children who are not diagnosed with the disorder. To examine this relationship, a researcher obtains a random sample of n = 36 children, 8 to 12 years old, who have been diagnosed with ADHD. Each child is asked to keep a journal recording how much time each day is spent watching TV. The average daily time for the sample is M = 4.9 hours. It is known that the average time for the general population of 8 to 12-year-old children is μ = 4.1 hours with σ = 1.8. Are the data sufficient to conclude that children with ADHD watch significantly more TV than children without the disorder? Use a two-tailed test with = .05. Which of the below options is the best answer? Answer A or B in the box Option A. The children with ADHD are significantly different.Option B. The children with ADHD are notsignificantly different. If the researcher had used a sample of n = 9 children and obtained the same sample mean, would the results…arrow_forwardCompute the standard scores for the values 0.49, 0.18,and 0.90. Interpret these scores. What conclusions can you make about these data values based on their standard scoresarrow_forward
- A randc v ection of volunteers at a research institute have been exposed to a typical cold virus. After they started to have cold symptoms, 15 of them were given multivitamin tablets daily which contain 3 grams of vitamin C and various other vitamins and minerals. The remaining 15 volunteers were given placebo tablets. For each individual, the length of time taken to recover from cold is recorded. At the end of the experiment following data are obtained: Days to recover from cold Treated with multivitamin 3.0, 3.2, 6.3, 3.8, 5.8, 7.3, 5.3, 5.7, 7.9, 5.7, 6.2, 4.3, 3.8, 6.1, 4.6 Treated with placebo 7.1, 5.9, 5.5, 5.2, 2.4, 3.7, 4.9, 3.5, 4.3, 6.6, 4.5, 3.2, 3.4, 4.1, 2.9 Send data to calculator v It is known that the population standard deviation of recovery time from cold is 1.8 days when treated with multivitamin, and the population standard deviation of recovery time from cold is 1.5 days when treated with placebo tablets. It is also known that both populations are approximately…arrow_forwardCompute the value of the test statistic and conclude.arrow_forwardRecent results suggest that children with ADHD tend to watch more TV than children who are not diagnosed with the disorder. To examine this relationship, a researcher obtains a random sample of n = 36 children, 8 to 12 years old, who have been diagnosed with ADHD. Each child is asked to keep a journal recording how much time each day is spent watching TV. The average daily time for the sample is X-bar = 4.9 hours. It is known that the average time for the general population of 8 to 12-year-old children is μ = 4.1 hours with σ = 1.8. a) Are the data sufficient to conclude that children with ADHD watch significantly more TV than children without ADHD? Use a two-tailed test with α = .05. b) If the researcher had used a sample of n = 9 children and obtained the same sample mean, would the results be sufficient to reject H0?arrow_forward
- A researcher is interested in testing the relationship between smoking and BMI (kg/m2) in adults aged 30-45. In order to test this association, the researcher divides smoking into currently more than a pack a day, currently less than a pack a day, and never smokers. The following table represents the BMIs for each participant enrolled by their respective smoking category. Current Smoker (≥1pack/day) Current Smoker (<1 pack/day Never Smoked 26.7 29.4 22.1 29.4 28.6 30.4 24.3 27.4 21.3 28.4 23.2 26.4 21.6 20.1 19.7 27.4 20.6 19.8 26.8 19.7 21.6 36.4 19.6 22.3 31.5 21.6 24.3 27.4 21.5 *Continue as though all assumptions for ANOVA are met. A) Calculate the MSW and MSB for the data represented above. B) Carry out a formal test for a one-way analysis of variance among the groups and interpret your results.arrow_forwardA paper investigated the driving behavior of teenagers by observing their vehicles as they left a high school parking lot and then again at a site approximately mile from the school. Assume that it is reasonable to regard the teen drivers in this 2 study as representative of the population of teen drivers. Amount by Which Speed Limit Was Exceeded Female Driver -0.1 0.4 1.1 0.7 1.1 1.2 0.1 0.9 0.5 0.5 (a) Use a .01 level of significance for any hypothesis tests. Data consistent with summary quantities appearing in the paper are given in the table. The measurements represent the difference between the observed vehicle speed and the posted speed limit (in miles per hour) for a sample of male teenage drivers and a sample of female teenage drivers. (Use males-females. Round your test statistic to two decimal places. Round your degrees of freedom down to the nearest whole number. Round your p-value to three decimal places.) t = df = P= Male Driver 1.4 1.2 0.9 2.1 0.7 1.3 3 1.3 0.6 2.1 (b) Do…arrow_forwardA researcher wonders whether younger mothers have babies that are significantly heavier or lighter than the population average of μ 7.25 pounds. The researcher collects data from N = 35 babies who were born to mothers between the ages of 16 and 18. The average weight for these babies was M = 7.15 pounds (SD = .6 pounds).arrow_forward
- The state of California is working very hard to ensure that all elementary age students whose native language is not English become proficient in English by the sixth grade. Their progress is monitored each year using the California English Language Development test. The results for two school districts in southern California for the 2003 school year are given in the accompanying table.7 Do the data indicate a significant difference in the 2003 proportions of students who are fluent in English for the two districts? Use α = .01.arrow_forwardRangecient of Variaice: 45.31N 6.- The day after Thanksgiving-called Black Friday–is one of the largest shopping days in the United States. A group of researchers conducted interviews with a sample of 38 women shopping on Black Friday to gauge their shopping habits and reported the results in a published paper, in 2011. One question was, "“How many hours do you usually spend shopping on Black Friday?" Data for the 38 shoppers are listed here: 66443 16 4 4 5 6 6 5 5 4 6 5 6 4 5 4 44 7 12 5 86 10 5 8 8 3 38 5 6 10 11. Descriptive statistics for these data are in this table: AExplore Data - Descriptive Statistics Options Which column of data would you like to explore? Summary statistics: Explore Data - Column 4 Variance Std. dev. Std. err. . Median Range Min Max Q1 Q3 Column n Mean Sample Size, ni 38 6.078947 38 6 0789474 7 5881935 2.7546676 044686609 13 3 16 4 7 var4 Meani Nedi an: Midrange: 9.5 6.658987 7.588193 Standard Deviation, s I 2.754668 Mean Absolute Deviation 1.958449 Variance,…arrow_forwardDecide whether the following results from a statistical study represent a sample statistic or a population parameter c. A medical study showed that the heart rate profile during exercise and recovery is a predictor of sudden death. Of the 5713 men studied, the mean maximum heart rate during exercise was found to be 96 BPM in subjects who died suddenly from cardiac causes during the 23 years when the follow up was conducted.arrow_forward
 Glencoe Algebra 1, Student Edition, 9780079039897...AlgebraISBN:9780079039897Author:CarterPublisher:McGraw Hill