
STATISTICS F/BUSINESS+ECONOMICS-TEXT
13th Edition
ISBN: 9781305881884
Author: Anderson
Publisher: CENGAGE L
expand_more
expand_more
format_list_bulleted
Concept explainers
Videos
Textbook Question
Chapter 11.1, Problem 8E
Consider a day when the Dow Jones industrial average went up 149.82 points. The following table shows the stock price changes for a sample of 12 companies on that day.
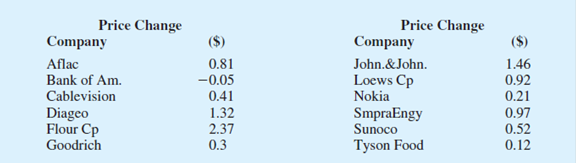
- a. Compute the sample variance for the daily price change.
- b. Compute the sample standard deviation for the price change.
- c. Provide 95% confidence
interval estimates of the population variance and the population standard deviation.
Expert Solution & Answer

Trending nowThis is a popular solution!

Chapter 11 Solutions
STATISTICS F/BUSINESS+ECONOMICS-TEXT
Ch. 11.1 - Find the following chi-square distribution values...Ch. 11.1 - A sample of 20 items provides a sample standard...Ch. 11.1 - A sample of 16 items provides a sample standard...Ch. 11.1 - The variance in drug weights is critical in the...Ch. 11.1 - John Calipari, head basketball coach for the 2012...Ch. 11.1 - Americans spend nearly 7 billion on Halloween...Ch. 11.1 - To analyze the risk, or volatility, associated...Ch. 11.1 - Consider a day when the Dow Jones industrial...Ch. 11.1 - An automotive part must be machined to close...Ch. 11.1 - Consumer Reports uses a 100-point customer...
Ch. 11.1 - At the end of 2008, the variance in the semiannual...Ch. 11.1 - A Fortune study found that the variance in the...Ch. 11.2 - Find the following F distribution values from...Ch. 11.2 - A sample of 16 items from population 1 has a...Ch. 11.2 - Consider the following hypothesis test....Ch. 11.2 - Investors commonly use the standard deviation of...Ch. 11.2 - Most individuals are aware of the fact that the...Ch. 11.2 - Data were collected on the top 1000 financial...Ch. 11.2 - The variance in a production process is an...Ch. 11.2 - On the basis of data provided by a Romac salary...Ch. 11.2 - Many smartphones, especially those of the...Ch. 11.2 - A research hypothesis is that the variance of...Ch. 11 - Because of staffing decisions, managers of the...Ch. 11 - Initial public offerings (IPOs) of stocks are on...Ch. 11 - The estimated daily living costs for an executive...Ch. 11 - Part variability is critical in the manufacturing...Ch. 11 - The filling variance for boxes of cereal is...Ch. 11 - City Trucking, Inc., claims consistent delivery...Ch. 11 - A sample of 9 days over the past six months showed...Ch. 11 - A sample standard deviation for the number of...Ch. 11 - Is there any difference in the variability in golf...Ch. 11 - The grade point averages of 352 students who...Ch. 11 - The accounting department analyzes the variance of...Ch. 11 - Two new assembly methods are tested and the...
Knowledge Booster


Learn more about
Need a deep-dive on the concept behind this application? Look no further. Learn more about this topic, statistics and related others by exploring similar questions and additional content below.Recommended textbooks for you
 Glencoe Algebra 1, Student Edition, 9780079039897...AlgebraISBN:9780079039897Author:CarterPublisher:McGraw Hill
Glencoe Algebra 1, Student Edition, 9780079039897...
Algebra
ISBN:9780079039897
Author:Carter
Publisher:McGraw Hill
Statistics 4.1 Point Estimators; Author: Dr. Jack L. Jackson II;https://www.youtube.com/watch?v=2MrI0J8XCEE;License: Standard YouTube License, CC-BY
Statistics 101: Point Estimators; Author: Brandon Foltz;https://www.youtube.com/watch?v=4v41z3HwLaM;License: Standard YouTube License, CC-BY
Central limit theorem; Author: 365 Data Science;https://www.youtube.com/watch?v=b5xQmk9veZ4;License: Standard YouTube License, CC-BY
Point Estimate Definition & Example; Author: Prof. Essa;https://www.youtube.com/watch?v=OTVwtvQmSn0;License: Standard Youtube License
Point Estimation; Author: Vamsidhar Ambatipudi;https://www.youtube.com/watch?v=flqhlM2bZWc;License: Standard Youtube License