
Videos
The article “Fatigue Limits of Enamel Bonds with Moist and Dry Techniques” (Dental Materials, 2009:1527–1531) described an experiment to investigate the ability of adhesive systems to bond to mineralized tooth structures. The response variable is shear bond strength (MPa), and two different adhesives (Adper Single Bond Plus and OptiBond Solo Plus) were used in combination with two different surface conditions. The accompanying data was supplied by the authors of the article. The first 12observations came from the SBP-dry treatment, the next12 from the SBP-moist treatment, the next 12 from the OBP-dry treatment, and the last 12 from the OBP-moist treatment.
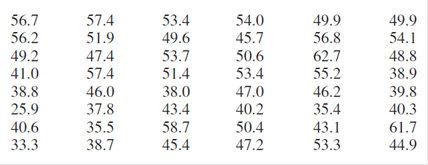
a. Construct a comparative boxplot of the data on the four different treatments and comment.
b. Carry out an appropriate analysis of variance and state your conclusions (use a significance level of .01for any tests). Include any graphs that provide insight.
c. If a significance level of .05 is used for the two-way ANOVA, the interaction effect is significant (just as in general different glues work better with some materials than with others). So now it makes sense to carry out a one-way ANOVA on the four treatments SBP-D, SBP-M, OBP-D, and OBP-M. Do this, and identify significant differences among the treatments.
Want to see the full answer?
Check out a sample textbook solution
Chapter 11 Solutions
Probability and Statistics for Engineering and the Sciences


- The article “Hydrogeochemical Characteristics of Groundwater in a Mid-Western CoastalAquifer System” (S. Jeen, J. Kim, et al., Geosciences Journal, 2001:339–348) presentsmeasurements of various properties of shallow groundwater in a certain aquifer system inKorea. Following are measurements of electrical conductivity (in microsiemens percentimeter) for 23 water samples.2099 528 2030 1350 1018 384 14991265 375 424 789 810 522 513488 200 215 486 257 557 260461 500Find the mean.Find the standard deviation.Find the median.Construct a dotplot.Find the 10% trimmed mean.Find the first quartile.Find the third quartile.Find the interquartile range.Construct a boxplot.Which of the points, if any, are outliers?If a histogram were constructed, would it be skewed to the left, skewed to the right, orapproximately symmetric?arrow_forwardQ1 A) List down the measures of central tendency and measures of dispersion 2) The operations manager of a plant that manufactures tires wants to compare the actual inner diameters of two grades of tires, each of B) which is expected to be 575 millimeters. A sample of five tires of each grade was selected, and the results representing the inner diameters of the tires, ranked from smallest to largest, are as follows. Grade X grade Y 568 570 575 578 584 573 574 575 577 578 requirement. a) for each of the tow grades of tries, compute the mwan, median, and standred deviation. b) which grade of tire providing better quality? explain. c) what would be the effect on your answer in (a) and (b) if the last value for grade Y were 588 insert 578 explain. C) The file contins the overall miles per gallon (MPG) OF 2010 family sedan: 24 21 22 23 24 34 34 34 20 20 22 22 44 32 20 20 22 20 39 20 Source:…arrow_forwardA study of the properties of metal plate-connected trusses used for roof support yielded the following observations on axial stiffness index (kips/in.) for plate lengths 4, 6, 8, 10, and 12 in: 4: 323.2 409.5 311.0 326.5 316.8 349.8 309.7 6: 423.1 347.2 361.0 404.5 331.0 348.9 381.7 8: 393.4 366.2 351.0 357.1 409.9 367.3 382.0 10: 362.7 452.9 461.4 433.1 410.6 384.2 362.6 12: 418.4 441.8 419.9 410.7 473.4 441.2 465.8 Does variation in plate length have any effect on true average axial stiffness? State the relevant hypotheses using analysis of variance. H0: ?1 ≠ ?2 ≠ ?3 ≠ ?4 ≠ ?5Ha: at least two ?i's are equalH0: ?1 = ?2 = ?3 = ?4 = ?5Ha: all five ?i's are unequal H0: ?1 = ?2 = ?3 = ?4 = ?5Ha: at least two ?i's are unequalH0: ?1 ≠ ?2 ≠ ?3 ≠ ?4 ≠ ?5Ha: all five ?i's are equal Test the relevant hypotheses using analysis of variance with ? = 0.01. Display your results in an ANOVA table. (Round your answers to two decimal places.) Source Degrees offreedom Sum…arrow_forward
- The article “Magma Interaction Processes Inferred from Fe-Ti Oxide Compositions in the Dölek and Sariçiçek Plutons, Eastern Turkey” (O. Karsli, F. Aydin, et al., Turkish Journal of Earth Sciences, 2008:297–315) presents chemical compositions (in weight-percent) for several rock specimens. Fourteen specimens (two outliers were removed) of limenite grain had an average iron oxide (Fe2O3) content of 9.30 with a standard deviation of 2.71, and seven specimens of limenite lamella had an average iron oxide content of 9.47 with a standard deviation of 2.22. Can you conclude that the mean iron oxide content differs between limenite grain and limenite lamella?arrow_forwardConsider the accompanying data on flexural strength (MPa) for concrete beams of a certain type. 5.5 7.2 7.3 6.3 8.1 6.8 7.0 7.2 6.8 6.5 7.0 6.3 7.9 9.0 8.7 8.7 7.8 9.7 7.4 7.7 9.7 8.0 7.7 11.6 11.3 11.8 10.7 The data below give accompanying strength observations for cylinders. 6.6 5.8 7.8 7.1 7.2 9.2 6.6 8.3 7.0 8.4 7.3 8.1 7.4 8.5 8.9 9.8 9.7 14.1 12.6 11.3 Prior to obtaining data, denote the beam strengths by X1, . . . , Xm and the cylinder strengths by Y1, . . . , Yn. Suppose that the Xi's constitute a random sample from a distribution with mean μ1 and standard deviation σ1 and that the Yi's form a random sample (independent of the Xi's) from another distribution with mean μ2 and standard deviation σ2. Compute the estimated standard error. (Round your answer to three decimal places.) (c) Calculate a point estimate of the ratio σ1/σ2 of the two standard deviations. (Round your answer to three decimal places.) (d) Suppose a single beam and a single cylinder are…arrow_forwardConsider the accompanying data on flexural strength (MPa) for concrete beams of a certain type. 5.3 7.2 7.3 6.3 8.1 6.8 7.0 7.1 6.8 6.5 7.0 6.3 7.9 9.0 9.0 8.7 7.8 9.7 7.4 7.7 9.7 7.9 7.7 11.6 11.3 11.8 10.7 The data below give accompanying strength observations for cylinders. 6.8 5.8 7.8 7.1 7.2 9.2 6.6 8.3 7.0 9.0 7.6 8.1 7.4 8.5 8.9 9.8 9.7 14.1 12.6 11.8 Prior to obtaining data, denote the beam strengths by X1, . . . , Xm and the cylinder strengths by Y1, . . . , Yn. Suppose that the Xi's constitute a random sample from a distribution with mean ?1 and standard deviation ?1 and that the Yi's form a random sample (independent of the Xi's) from another distribution with mean ?2 and standard deviation ?2. (a) Calculate the estimate for the given data. (Round your answer to three decimal places.) (b) Use rules of variance to obtain an expression for the variance and standard deviation (standard error) of the estimator in part (a). V(X − Y) = V(X) + V(Y) =…arrow_forward
- An article in the Journal of Applied Polymer Science (Vol. 56, pp. 471–476, 1995) studied the effect of the mole ratio of sebacic acid on the intrinsic viscosity of copolyesters.- The data follows: Viscosity 0.45 0.2 0.34 0.58 0.7 0.57 0.55 0.44 Mole ratio 1 0.9 0.8 0.7 0.6 0.5 0.4 0.3 (a) Construct a scatter diagram of the data.arrow_forwardThe article “Withdrawal Strength of Threaded Nails” (D. Rammer, S. Winistorfer, and D. Bender, Journal of Structural Engineering 2001:442–449) describes an experiment comparing the ultimate withdrawal strengths (in N/mm) for several types of nails. For an annularly threaded nail with shank diameter 3.76 mm driven into spruce-pine-fir lumber, the ultimate withdrawal strength was modeled as lognormal with μ = 3.82 and σ = 0.219. For a helically threaded nail under the same conditions, the strength was modeled as lognormal with μ = 3.47 and σ = 0.272. a) What is the mean withdrawal strength for annularly threaded nails? b) What is the mean withdrawal strength for helically threaded nails? c) For which type of nail is it more probable that the withdrawal strength will be greater than 50 N/mm? d) What is the probability that a helically threaded nail will have a greater withdrawal strength than the median for annularly threaded nails? e) An experiment is performed in which withdrawal…arrow_forwardThe article “Wind-Uplift Capacity of Residential Wood Roof-Sheathing Panels Retrofitted with Insulating Foam Adhesive” (P. Datin, D. Prevatt, and W. Pang, Journal of Architectural Engineering, 2011:144–154) presents a study of the failure pressures of roof panels. Following are the failure pressures, in kPa, for five panels constructed with 6d smooth shank nails. These data are consistent with means and standard deviations presented in the article. 3.32 2.53 3.45 2.38 3.01 Find a 95% confidence interval for the mean failure pressure for this type of roof panel.arrow_forward
- A paper investigated the driving behavior of teenagers by observing their vehicles as they left a high school parking lot and then again at a site approximately 1 2 mile from the school. Assume that it is reasonable to regard the teen drivers in this study as representative of the population of teen drivers. Amount by Which Speed Limit Was Exceeded MaleDriver FemaleDriver 1.3 -0.1 1.3 0.4 0.9 1.1 2.1 0.7 0.7 1.1 1.3 1.2 3 0.1 1.3 0.9 0.6 0.5 2.1 0.5 (a) Use a .01 level of significance for any hypothesis tests. Data consistent with summary quantities appearing in the paper are given in the table. The measurements represent the difference between the observed vehicle speed and the posted speed limit (in miles per hour) for a sample of male teenage drivers and a sample of female teenage drivers. (Use μmales − μfemales.Round your test statistic to two decimal places. Round your degrees of freedom down to the nearest whole number. Round your p-value to…arrow_forwardA paper investigated the driving behavior of teenagers by observing their vehicles as they left a high school parking lot and then again at a site approximately 1 2 mile from the school. Assume that it is reasonable to regard the teen drivers in this study as representative of the population of teen drivers. Amount by Which Speed Limit Was Exceeded MaleDriver FemaleDriver 1.2 -0.1 1.4 0.4 0.9 1.1 2.1 0.7 0.7 1.1 1.3 1.2 3 0.1 1.3 0.9 0.6 0.5 2.1 0.5 (a) Use a .01 level of significance for any hypothesis tests. Data consistent with summary quantities appearing in the paper are given in the table. The measurements represent the difference between the observed vehicle speed and the posted speed limit (in miles per hour) for a sample of male teenage drivers and a sample of female teenage drivers. (Use μmales − μfemales.Round your test statistic to two decimal places. Round your degrees of freedom down to the nearest whole number. Round your p-value to…arrow_forwardAn urban community wants to show that the incidence of breast cancer is higher in their locality than in a neighboring rural area. (PCB levels were found to be higher in the soil of the urban community). If you find that in the urban community 20 out of 200 adult women have breast cancer and that in the rural community 10 out of 150 adult women have it, could you conclude, at a significance level of 0.05, that breast cancer is more prevalent in the urban community?1. The parameter of interest is:2. The hypotheses for this test are:3. The calculated test statistic is:4. The critical region is:5. Draw the critical region (make decision):6. It can be concluded that:arrow_forward
 MATLAB: An Introduction with ApplicationsStatisticsISBN:9781119256830Author:Amos GilatPublisher:John Wiley & Sons Inc
 Probability and Statistics for Engineering and th...StatisticsISBN:9781305251809Author:Jay L. DevorePublisher:Cengage Learning
 Statistics for The Behavioral Sciences (MindTap C...StatisticsISBN:9781305504912Author:Frederick J Gravetter, Larry B. WallnauPublisher:Cengage Learning
 Elementary Statistics: Picturing the World (7th E...StatisticsISBN:9780134683416Author:Ron Larson, Betsy FarberPublisher:PEARSON
 The Basic Practice of StatisticsStatisticsISBN:9781319042578Author:David S. Moore, William I. Notz, Michael A. FlignerPublisher:W. H. Freeman
 Introduction to the Practice of StatisticsStatisticsISBN:9781319013387Author:David S. Moore, George P. McCabe, Bruce A. CraigPublisher:W. H. Freeman