
Concept explainers
Videos
a.
Calculate the
a.
Answer to Problem 35E
The correlation between math score and verbal SAT score is 0.75.
Explanation of Solution
Calculation:
The verbal SAT scores (x) and the math SAT scores (y) of six fishermen are given.
Correlation:
The
Software procedure:
Step-by-step procedure to obtain the correlation using the MINITAB software:
- Choose Stat > Basic Statistics > Correlation.
- In Variables, enter the columns of x and y.
- Click OK.
Output using the MINITAB software is given below:
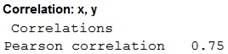
Hence, the correlation between math score and verbal SAT score is 0.75.
b.
Calculate the mean and standard deviation,
b.
Answer to Problem 35E
The mean,
The standard deviation,
Explanation of Solution
Calculation:
Denote
Software procedure:
Step-by-step procedure to obtain the descriptive statistics using the MINITAB software:
- Choose Stat > Basic Statistics > Display Descriptive Statistics, click OK.
- In Variables, enter the columns of x.
- Choose Statistics, select Mean, Standard deviation and click OK.
- Click OK.
Output using the MINITAB software is given below:
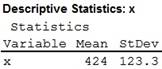
From the above output, it is evident that the mean,
c.
Calculate the mean and standard deviation,
c.
Answer to Problem 35E
The mean,
The standard deviation,
Explanation of Solution
Calculation:
Denote
Descriptive statistics:
Software procedure:
Step-by-step procedure to obtain the descriptive statistics using the MINITAB software:
- Choose Stat > Basic Statistics > Display Descriptive Statistics, click OK.
- In Variables, enter the columns of y.
- Choose Statistics, select Mean, Standard deviation and click OK.
- Click OK.
Output using the MINITAB software is given below:
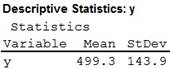
From the above output, it is evident that the mean,
d.
Find the least-squares regression line to predict the math score from the verbal score.
d.
Answer to Problem 35E
The least-squares regression line to predict the math score from the verbal score is
Explanation of Solution
Calculation:
Least-squares regression:
For an ordered pairs of values of variables, (x, y) with respective means
Regression:
Software procedure:
Step by step procedure to obtain regression using Minitab software is given as,
- Choose Stat > Regression > Regression > Fit Regression Model.
- In Responses, enter the numeric column containing the response data y.
- In Continuous Predictors, enter the numeric column containing the predictor variable x.
- Choose Results, select Regression equation and click OK.
- Click OK.
Output using MINITAB software is given below:
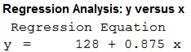
From the output, the least-squares regression line to predict the math score from the verbal score is
e.
Find the z-score for each value of x.
e.
Answer to Problem 35E
The z-scores for the values of x are:
| 0.0324 |
| –0.3082 |
| 1.8573 |
| –0.8759 |
| 0.1135 |
| –0.8191 |
Explanation of Solution
Calculation:
The z-score for an x-value is denoted as
Here,
The calculation for the z-scores for the values of x is shown in the following table:
| x | ||
| 428 | 4 | 0.0324 |
| 386 | –38 | –0.3082 |
| 653 | 229 | 1.8573 |
| 316 | –108 | –0.8759 |
| 438 | 14 | 0.1135 |
| 323 | –101 | –0.8191 |
f.
Find the z-score for each value of y.
f.
Answer to Problem 35E
The z-score for the values of y are:
| –0.8777 |
| 0.4983 |
| 1.2974 |
| –1.2530 |
| 0.7484 |
| –0.4121 |
Explanation of Solution
Calculation:
The z-score for a y-value is denoted as
Here,
The calculation for the z-scores for the values of y is shown in the following table:
| y | ||
| 373 | –126.3 | –0.8777 |
| 571 | 71.7 | 0.4983 |
| 686 | 186.7 | 1.2974 |
| 319 | –180.3 | –1.2530 |
| 607 | 107.7 | 0.7484 |
| 440 | –59.3 | –0.4121 |
g.
Find the correlation coefficient, r, between
Explain whether this correlation is the same as the correlation between math and verbal SAT scores.
g.
Answer to Problem 35E
The correlation, r, between
The correlation between
Explanation of Solution
Calculation:
Correlation:
Software procedure:
Step-by-step procedure to obtain the correlation using the MINITAB software:
- Choose Stat > Basic Statistics > Correlation.
- In Variables, enter the columns of zx and zy.
- Click OK.
Output using the MINITAB software is given below:
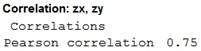
Hence, the correlation, r, between
Observe that the correlation between math and verbal SAT scores obtained in part a is 0.75.
Hence, the correlation between
h.
Find the least-squares regression line to predict
Explain the reason the equation of the line is
h.
Answer to Problem 35E
The least-squares regression line to predict
Explanation of Solution
Calculation:
Regression:
Software procedure:
Step by step procedure to obtain regression using Minitab software is given as,
- Choose Stat > Regression > Regression > Fit Regression Model.
- In Responses, enter the numeric column containing the response data zy.
- In Continuous Predictors, enter the numeric column containing the predictor variable zx.
- Choose Results, select Regression equation and click OK.
- Click OK.
Output using MINITAB software is given below:
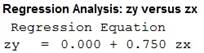
From the output, the least-squares regression line obtained is:
Hence, the least-squares regression line to predict
Consider the least-squares regression equation:
Now,
Here,
Now, in terms of
Hence, the equation of the line in terms of
Want to see more full solutions like this?
Chapter 11 Solutions
Essential Statistics


 MATLAB: An Introduction with ApplicationsStatisticsISBN:9781119256830Author:Amos GilatPublisher:John Wiley & Sons Inc
 Probability and Statistics for Engineering and th...StatisticsISBN:9781305251809Author:Jay L. DevorePublisher:Cengage Learning
 Statistics for The Behavioral Sciences (MindTap C...StatisticsISBN:9781305504912Author:Frederick J Gravetter, Larry B. WallnauPublisher:Cengage Learning
 Elementary Statistics: Picturing the World (7th E...StatisticsISBN:9780134683416Author:Ron Larson, Betsy FarberPublisher:PEARSON
 The Basic Practice of StatisticsStatisticsISBN:9781319042578Author:David S. Moore, William I. Notz, Michael A. FlignerPublisher:W. H. Freeman
 Introduction to the Practice of StatisticsStatisticsISBN:9781319013387Author:David S. Moore, George P. McCabe, Bruce A. CraigPublisher:W. H. Freeman