
Concept explainers
Videos
The paper “Less Air Pollution Leads to Rapid Reduction of Airway Inflammation and Improved Airway
The authors of the paper used paired t tests to determine that there was a significant difference in the urban and rural means for each of these three measures. One of these tests resulted in a P-value less than 0.001, one resulted in a P-value between 0.001 and 0.01, and one resulted in a P-value between 0.01 and 0.05.
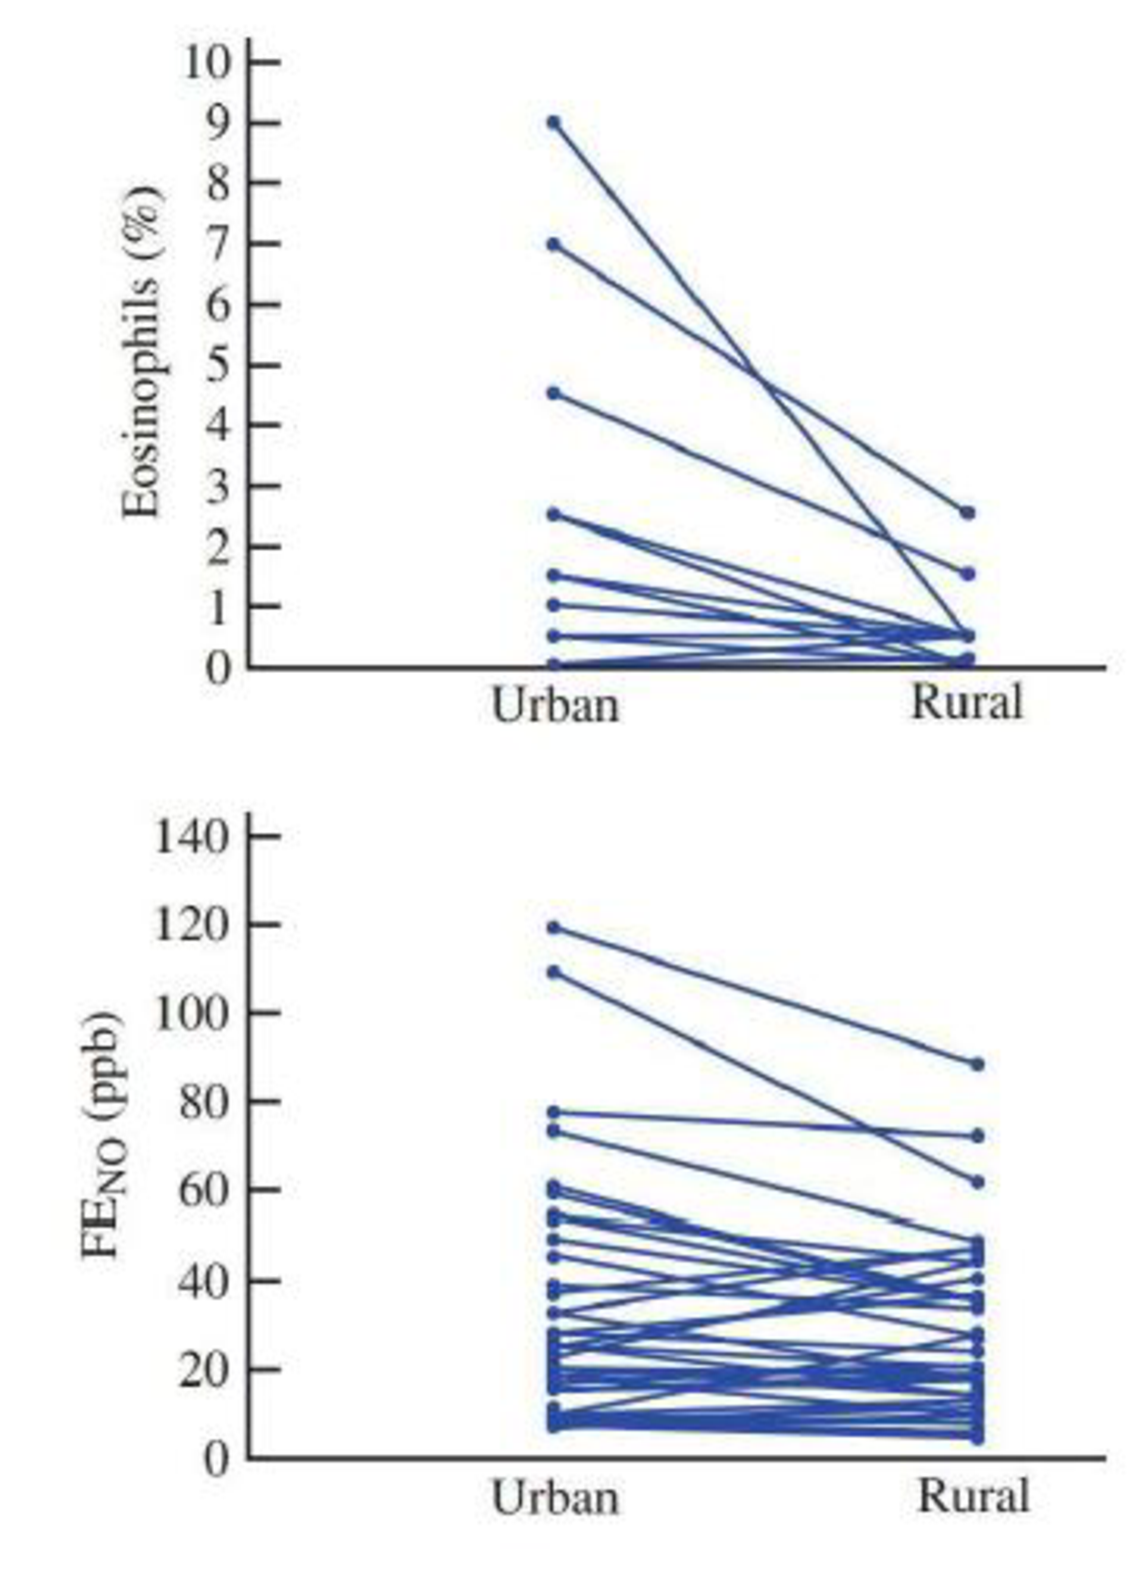
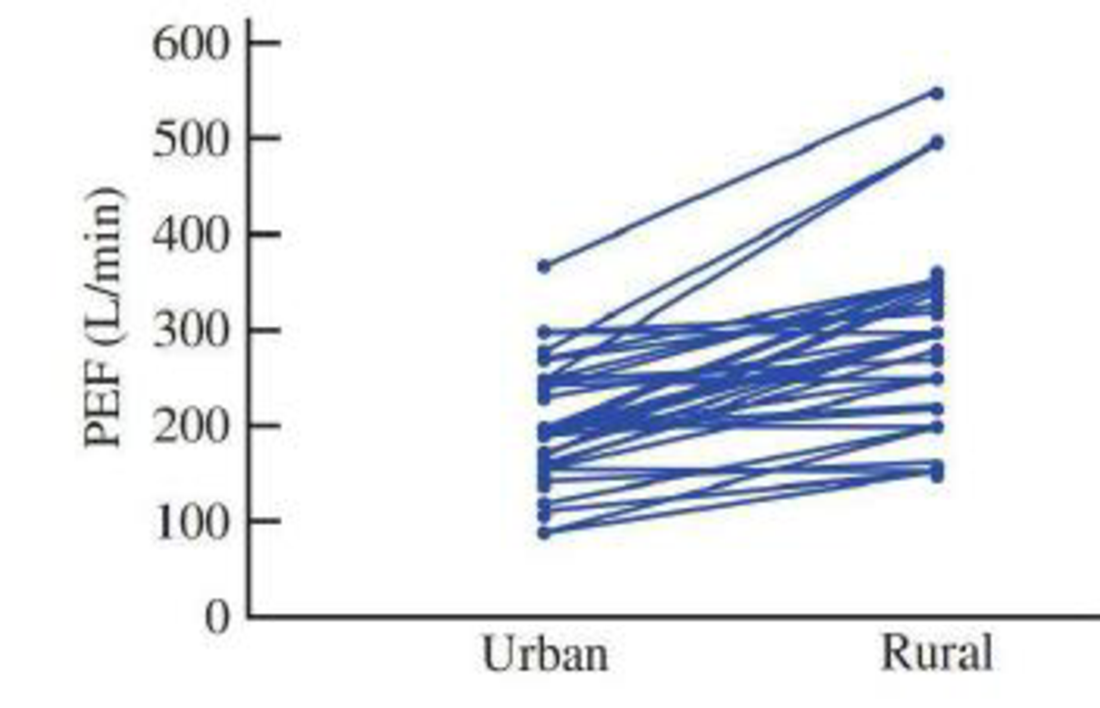
- a. Which measure (Eosinophils, FENO, or PEF) do you think resulted in a test with the P-value that was less than 0.001? Explain your reasoning.
- b. Which measure (Eosinophils, FENO, or PEF) do you think resulted in the test with the largest P-value? Explain your reasoning.
Want to see the full answer?
Check out a sample textbook solution
Chapter 11 Solutions
Introduction To Statistics And Data Analysis


- A researcher is interested in testing the relationship between smoking and BMI (kg/m2) in adults aged 30-45. In order to test this association, the researcher divides smoking into currently more than a pack a day, currently less than a pack a day, and never smokers. The following table represents the BMIs for each participant enrolled by their respective smoking category. Current Smoker (≥1pack/day) Current Smoker (<1 pack/day Never Smoked 26.7 29.4 22.1 29.4 28.6 30.4 24.3 27.4 21.3 28.4 23.2 26.4 21.6 20.1 19.7 27.4 20.6 19.8 26.8 19.7 21.6 36.4 19.6 22.3 31.5 21.6 24.3 27.4 21.5 *Continue as though all assumptions for ANOVA are met. A) Calculate the MSW and MSB for the data represented above. B) Carry out a formal test for a one-way analysis of variance among the groups and interpret your results.arrow_forwardA Canadian study measuring depression level in teens (as reported in the Journal of Adolescence, vol. 25, 2002) randomly sampled 112 male teens and 101 female teens, and scored them on a common depression scale (higher score representing more depression). The researchers suspected that the mean depression score for male teens is higher than for female teens, and wanted to check whether data would support this hypothesis. If μ1 and μ2 represent the mean depression score for male teens and female teens respectively, which of the following is an appropriate pair of hypotheses in this case? Check all that apply.arrow_forwardThe authors of this study report a Pearson correlation coefficient estimate of r = 0.23 with a p-value of <0.01. Interpret.arrow_forward
- A paper investigated the driving behavior of teenagers by observing their vehicles as they left a high school parking lot and then again at a site approximately 1 2 mile from the school. Assume that it is reasonable to regard the teen drivers in this study as representative of the population of teen drivers. Amount by Which Speed Limit Was Exceeded MaleDriver FemaleDriver 1.3 -0.1 1.3 0.4 0.9 1.1 2.1 0.7 0.7 1.1 1.3 1.2 3 0.1 1.3 0.9 0.6 0.5 2.1 0.5 (a) Use a .01 level of significance for any hypothesis tests. Data consistent with summary quantities appearing in the paper are given in the table. The measurements represent the difference between the observed vehicle speed and the posted speed limit (in miles per hour) for a sample of male teenage drivers and a sample of female teenage drivers. (Use μmales − μfemales.Round your test statistic to two decimal places. Round your degrees of freedom down to the nearest whole number. Round your p-value to…arrow_forwardAn experiment to determine if a migraine medication decreases a person's average number of monthly migraines is performed on 400 people who report they have several migraines a month. Researchers randomly assigned 200 people to the treatment group and 200 people to the control group. After the study, the researchers determined that 48 of the subjects in the treatment group and 28 of the subjects in the control group average fewer migraines per month. The data from the two groups are resampled 150 times, and the table shows the distribution of the differences of the proportions for the reconfigured treatment and control groups.arrow_forwardA paper investigated the driving behavior of teenagers by observing their vehicles as they left a high school parking lot and then again at a site approximately 1 2 mile from the school. Assume that it is reasonable to regard the teen drivers in this study as representative of the population of teen drivers. Amount by Which Speed Limit Was Exceeded MaleDriver FemaleDriver 1.2 -0.1 1.4 0.4 0.9 1.1 2.1 0.7 0.7 1.1 1.3 1.2 3 0.1 1.3 0.9 0.6 0.5 2.1 0.5 (a) Use a .01 level of significance for any hypothesis tests. Data consistent with summary quantities appearing in the paper are given in the table. The measurements represent the difference between the observed vehicle speed and the posted speed limit (in miles per hour) for a sample of male teenage drivers and a sample of female teenage drivers. (Use μmales − μfemales.Round your test statistic to two decimal places. Round your degrees of freedom down to the nearest whole number. Round your p-value to…arrow_forward
- A study was conducted to examine if children with autism spectrum disorder (ASD) had higher prenatal exposure to air pollution, specifically particulate matter < 2.5 g in diameter (PM2.5). Researchers obtained birth records of all children born in Los Angeles between 2000 and 2008 and linked these to the Department of Developmental Services records to determine if any of those subjects had been diagnosed with ASD or not. They used the birth addresses given in the birth records to determine the average daily PM2.5 for the third trimester for each child. The standard deviation for PM2.5 among ASD subjects was found to be 34.6 and for non-ASD subjects was 16.8. Assume PM2.5 is normally distributed. 4a. What was the study design? * Randomized Clinical Trial (RCT) * Case Report * Nested Case-Control Study * Case-Control Study * cross-sectional study Cohort Study 4B. What are the null and alternative hypotheses? 4c. What type of statistical test would you use to analyze the…arrow_forwardThe accompanying frequency distribution on depositedenergy (mJ) was extracted from the article “ExperimentalAnalysis of Laser-Induced Spark Ignition of LeanTurbulent Premixed Flames” (Combustion and Flame,2013: 1414–1427).1.0− , 2.0 5 2.0− , 2.4 112.4− , 2.6 13 2.6− , 2.8 302.8− , 3.0 46 3.0− , 3.2 663.2− , 3.4 133 3.4− , 3.6 1413.6− , 3.8 126 3.8− , 4.0 924.0− , 4.2 73 4.2− , 4.4 384.4− , 4.6 19 4.6− , 5.0 11a. What proportion of these ignition trials resulted in adeposited energy of less than 3 mJ?b. What proportion of these ignition trials resulted in adeposited energy of at least 4 mJ?c. Roughly what proportion of the trials resulted in adeposited energy of at least 3.5 mJ?d. Construct a histogram and comment on its shape.arrow_forwardThe manager of the purchasing department of a large banking organization would like to develop a model to predict the amount of time it takes to process invoices. Data are collected from a sample of 30 days with the following results: Relating time to invoices processed. Day Invoices Processed Completion Time (hours) Day Invoices Processed Completion Time (hours) 1 149 2.1 16 169 2.5 2 60 1.8 17 190 2.9 3 188 2.3 18 233 3.4 4 19 0.3 19 289 4.1 5 201 2.7 20 45 1.2 6 58 1.0 21 193 2.5 7 77 1.7 22 70 1.8 8 222…arrow_forward
- A large manufacturing company investigated the service it received from its suppliers and discovered that, in the past, 44% of all material shipments were received late. However, the company recently installed a just-in-time system in which suppliers are linked more closely to the manufacturing process. A random sample of 170 deliveries since the just-in-time system was installed reveals that 34 deliveries were late. If we want to test whether the proportion of late deliveries was reduced signicantly at = 0:01 the null and alternative hypotheses are a. Null hypothesis (H0) b. Alternative hypothesis (HA)arrow_forwardRecent publications have addressed the growing concern in the scientific community around the increased prevalence of CAT scans in children between the ages of 7-18 and the growing rate of childhood cancers. Suppose the researcher plans to gather a SRS from a group of children in this age range who have received one or more CAT scans, and a SRS from a group of children who have never received a CAT scan and compare the number of cases of childhood cancers that develop over a prolonged period of time. Assume the following table summarizes the descriptive statistics for his samples. Population Average cases of childhood cancers Standard deviaton Sample size >CAT scan 24.6 2.4 1,894 No CAT scans 11.4 1.9 2,745 A) Carry out the appropriate statistical test to answer the researcher’s hypothesis regarding the difference in average cases of childhood cancers in children aged 7-18 receiving one or more CAT scans versus those that have never received a CAT scan. Use an alpha level…arrow_forwardA study was undertaken to determine whether there was a significant weight (in lb) loss after one year course of therapy for diabetes, and whether the amount of weight (in lb) loss was related to initial weight. The following table gives the initial weight (x) and weight after one year of therapy (y) for 16 newly diagnosed adult diabetic patients.arrow_forward
 MATLAB: An Introduction with ApplicationsStatisticsISBN:9781119256830Author:Amos GilatPublisher:John Wiley & Sons Inc
 Probability and Statistics for Engineering and th...StatisticsISBN:9781305251809Author:Jay L. DevorePublisher:Cengage Learning
 Statistics for The Behavioral Sciences (MindTap C...StatisticsISBN:9781305504912Author:Frederick J Gravetter, Larry B. WallnauPublisher:Cengage Learning
 Elementary Statistics: Picturing the World (7th E...StatisticsISBN:9780134683416Author:Ron Larson, Betsy FarberPublisher:PEARSON
 The Basic Practice of StatisticsStatisticsISBN:9781319042578Author:David S. Moore, William I. Notz, Michael A. FlignerPublisher:W. H. Freeman
 Introduction to the Practice of StatisticsStatisticsISBN:9781319013387Author:David S. Moore, George P. McCabe, Bruce A. CraigPublisher:W. H. Freeman