
Concept explainers
Videos
a.
Find
a.
Answer to Problem 10E
The intercept
The slope
Explanation of Solution
Calculation:
The given information is that the sample data consists of 8 values for x and y.
Slope or
where,
r represents the
Software procedure:
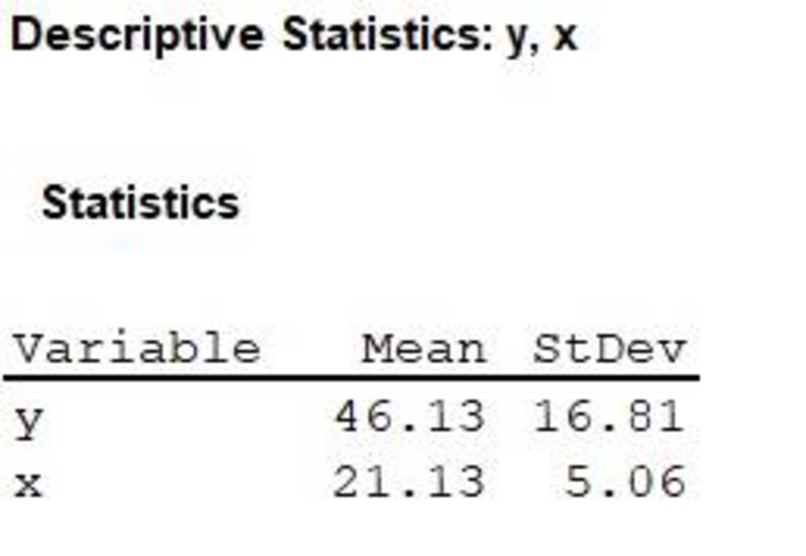
Step-by-step procedure to find the mean, standard deviation for x and y values using MINITAB is given below:
- Choose Stat > Basic Statistics > Display
Descriptive Statistics . - In Variables enter the columns of y and x.
- Choose Options Statistics, select Mean and Standard deviation.
- Click OK.
Output obtained from MINITAB is given below:
Correlation:
Where,
n represents the sample size.
The table shows the calculation of correlation:
| x | y | |||||
| 23 | 51 | 1.87 | 4.87 | 0.369565 | 0.289709 | 0.107066 |
| 16 | 22 | –5.13 | –24.13 | –1.01383 | –1.43546 | 1.455313 |
| 17 | 56 | –4.13 | 9.87 | –0.81621 | 0.587151 | –0.47924 |
| 19 | 34 | –2.13 | –12.13 | –0.42095 | –0.72159 | 0.303754 |
| 30 | 67 | 8.87 | 20.87 | 1.752964 | 1.241523 | 2.176345 |
| 19 | 59 | –2.13 | 12.87 | –0.42095 | 0.765616 | –0.32228 |
| 18 | 55 | –3.13 | 8.87 | –0.61858 | 0.527662 | –0.3264 |
| 27 | 25 | 5.87 | –21.13 | 1.160079 | –1.25699 | –1.45821 |
| Total | 1.456 |
Thus, the correlation is
Substitute r as 0.208,
Thus, the slope
Intercept or
Substitute
Thus, the intercept
b.
Find the predicted value
b.
Answer to Problem 10E
The predicted value
Explanation of Solution
Calculation:
The given value of x is 25.
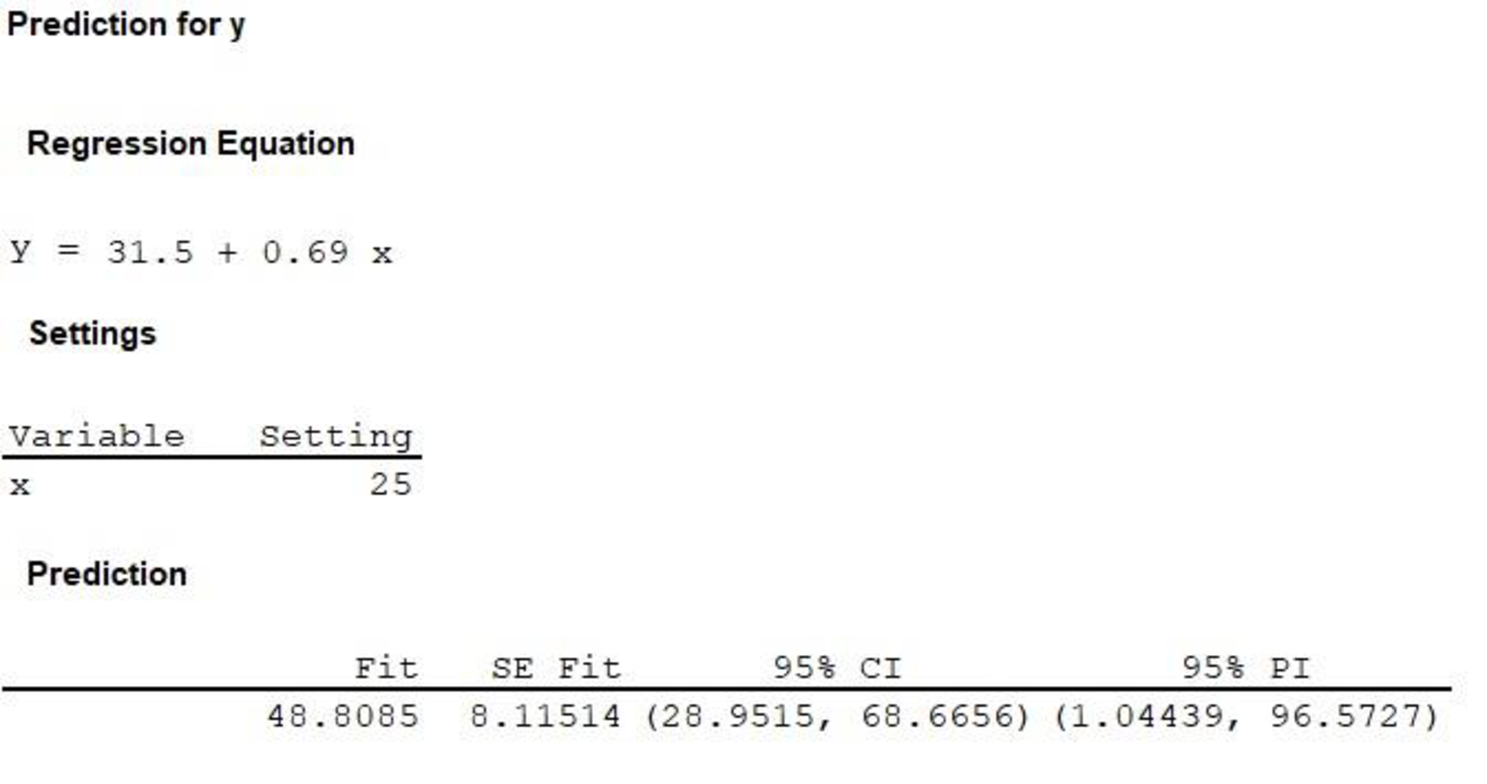
The estimated regression equation is
Substitute x as 25,
Thus, the predicted value
c.
Find the residual standard deviation
c.
Answer to Problem 10E
The residual standard deviation
Explanation of Solution
Calculation:
The residual standard deviation
Where,
n represents the sample size.
Use the estimated regression equation to find the predicted value of y for each value of x.
| y |  | ||
| 51 | 47.423 | 3.577 | 12.79493 |
| 22 | 42.586 | –20.586 | 423.7834 |
| 56 | 43.277 | 12.723 | 161.8747 |
| 34 | 44.659 | –10.659 | 113.6143 |
| 67 | 52.26 | 14.74 | 217.2676 |
| 59 | 44.659 | 14.341 | 205.6643 |
| 55 | 43.968 | 11.032 | 121.705 |
| 25 | 50.187 | –25.187 | 634.385 |
| Total | 1,891.09 |
Substitute
Thus, the residual standard deviation
d.
Find the sum of squares for x.
d.
Answer to Problem 10E
The sum of squares for x is 178.8752.
Explanation of Solution
Calculation:
The table shows the calculation of sum of squares for x:
| x | ||
| 23 | 1.87 | 3.4969 |
| 16 | -5.13 | 26.3169 |
| 17 | -4.13 | 17.0569 |
| 19 | -2.13 | 4.5369 |
| 30 | 8.87 | 78.6769 |
| 19 | -2.13 | 4.5369 |
| 18 | -3.13 | 9.7969 |
| 27 | 5.87 | 34.4569 |
| Total | 178.8752 |
Thus, the sum of squares for x is 178.8752.
e.
Find the critical value for a 95% confidence or prediction interval.
e.
Answer to Problem 10E
The critical value for a 95% confidence or prediction interval is 2.447.
Explanation of Solution
Calculation:
Critical value:
Software procedure:
Step-by-step procedure to find the critical value using MINITAB is given below:
- Choose Graph > Probability Distribution Plot choose View Probability > OK.
- From Distribution, choose ‘t’ distribution.
- In Degrees of freedom, enter 4.
- Click the Shaded Area tab.
- Choose Probability and Two tail for the region of the curve to shade.
- Enter the Probability value as 0.05.
- Click OK.
Output obtained from MINITAB is given below:
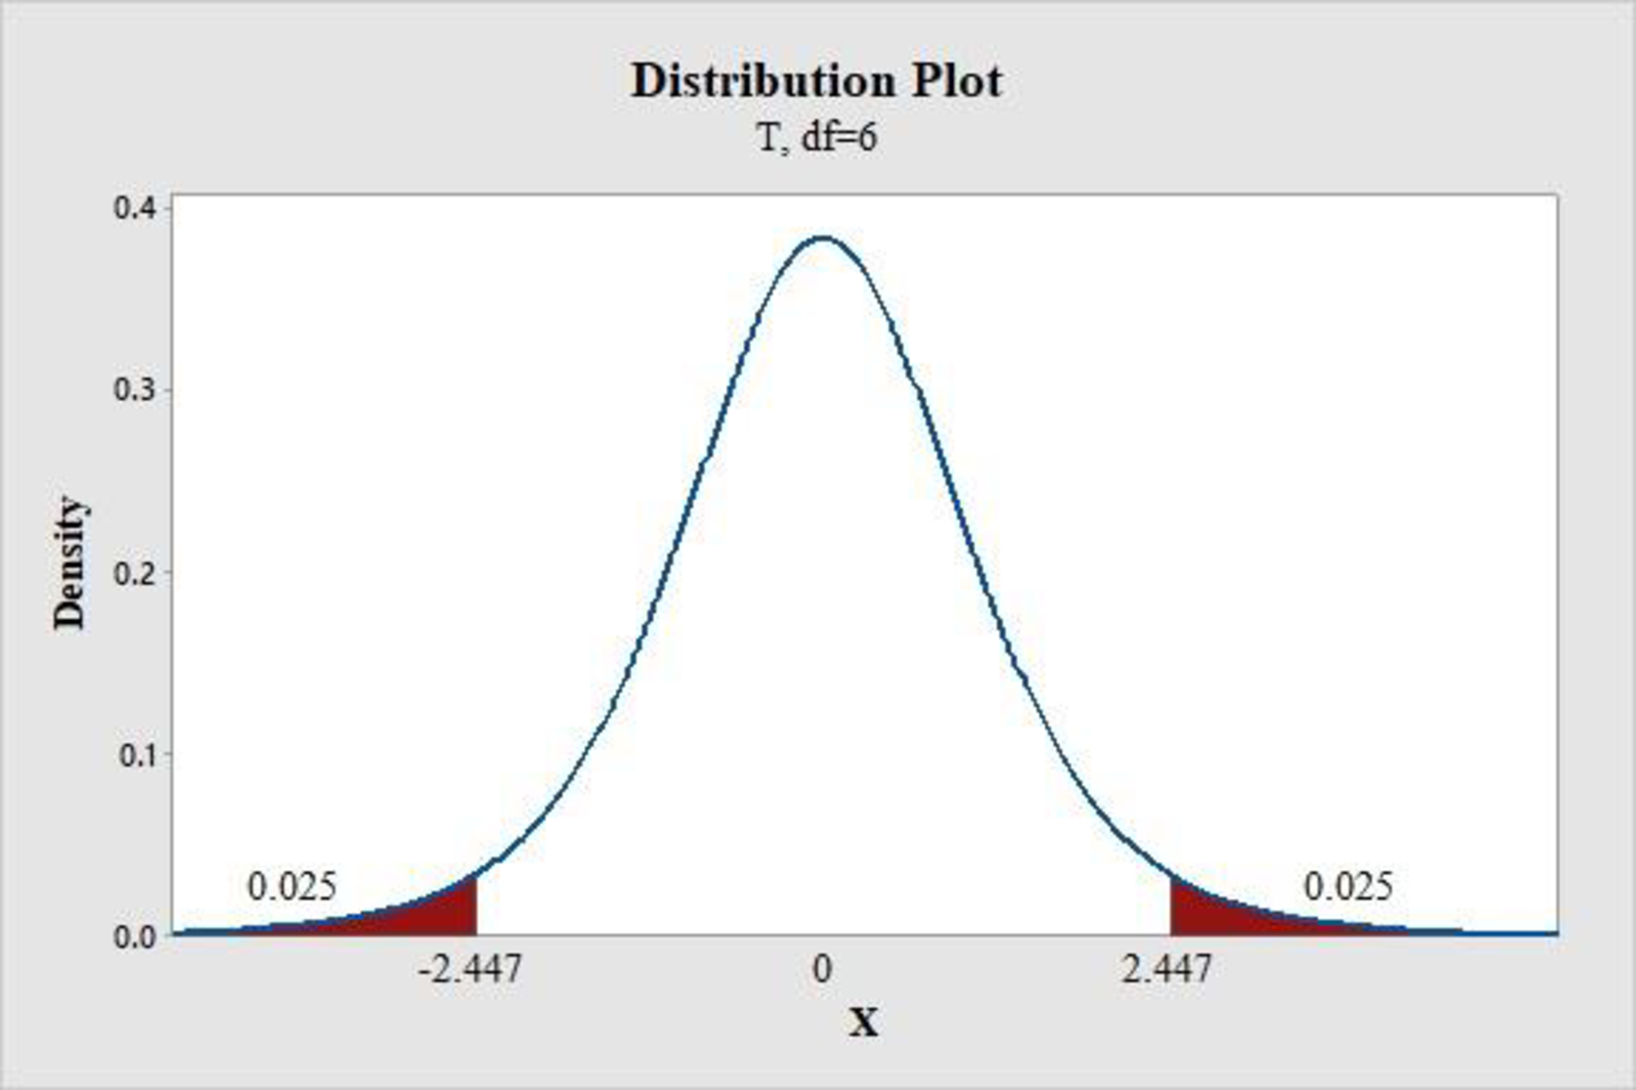
Thus, the critical value for a 95% confidence or prediction interval is 2.447.
f.
Construct the 95% confidence interval for the mean response for the given value of x.
f.
Answer to Problem 10E
The 95% confidence interval for the mean response for the given value of x is
Explanation of Solution
Calculation:
The given value of x is 25.
Software procedure:
Step-by-step procedure to construct the 95% confidence interval for the mean response for the given value of x is given below:
- Choose Stat > Regression > Regression.
- In Response, enter the column containing the y.
- In Predictors, enter the columns containing the x.
- Click OK.
- Choose Stat > Regression > Regression>Predict.
- Choose Enter the individual values.
- Enter the x as 25.
- Click OK.
Output obtained from MINITAB is given below:
Interpretation:
Thus, the 95% confidence interval for the mean response for the given value of x is
g.
Construct the 95% prediction interval for the individual response for the given value of x.
g.
Answer to Problem 10E
The 95% prediction interval for the individual response for the given value of x is
Explanation of Solution
From the MINITAB output obtained in the previous part (f) it can be observed that the 95% prediction interval for the individual response for the given value of x is
Want to see more full solutions like this?
Chapter 11 Solutions
Essential Statistics


- Find the critical value zα/2 that corresponds to a 91% confidence level.arrow_forwardEstimate the average number of feathers that a mature tom turkey has with 90% confidence interval by using a sample of 32 turkeys that had a mean of 3450 feathers and a standard deviation of 25 feathers.arrow_forwardA study conducted to examine the age of commercial jets in the United States sampled 36 planes and found the average age to be 12.6 years with a standard deviation of 2.7 a. Calculate and interpret a 90% confidence interval for the average age of commercial jets in the United States. b. A report in USA Today claimed that the mean age of commercial jets in the United States was 14 years. Using the confidence interval in (a), is there enough evidence to refute this claim?arrow_forward
- The quality-control manager at a compact fluorescent light bulb (CFL) factory needs to determine whether the mean life of a large shipment of CFLs is equal to 7520 hours. The population standard deviation is 910 hours . A random sample of 49 light bulbs indicates a sample mean life of 7312 hours. a. At the 0.05 level of significance, is there evidence that the mean life is different from 7520 hours ? b. Compute the p-value and interpret its meaning. c. Construct a 95% confidence interval estimate of the population mean life of the light bulbs. d. Compare the results of (a) and (c). What conclusions do you reach? e. Compare the results of parts (a) through (d) to those when the standard deviation is hours. Question content area bottom Part 1 a. Let µ be the population mean. Determine the null hypothesis, H0, and the alternative hypothesis,H1 . H0 : µ ▼ equals not equals less than or equals greater than or equals enter your response here H1 : µ ▼ less than equals…arrow_forwardA sample of 50 employees is found to have a mean of $32474 and a standard deviation of $1334. A) Construct a 95% confidence interval estimate of the true population mean.arrow_forwardA biologist reports a confidence interval of (3.5,3.9) when estimating the mean height (in centimeters) of a sample of seedlings. the estimated margin of error is?arrow_forward
 MATLAB: An Introduction with ApplicationsStatisticsISBN:9781119256830Author:Amos GilatPublisher:John Wiley & Sons Inc
 Probability and Statistics for Engineering and th...StatisticsISBN:9781305251809Author:Jay L. DevorePublisher:Cengage Learning
 Statistics for The Behavioral Sciences (MindTap C...StatisticsISBN:9781305504912Author:Frederick J Gravetter, Larry B. WallnauPublisher:Cengage Learning
 Elementary Statistics: Picturing the World (7th E...StatisticsISBN:9780134683416Author:Ron Larson, Betsy FarberPublisher:PEARSON
 The Basic Practice of StatisticsStatisticsISBN:9781319042578Author:David S. Moore, William I. Notz, Michael A. FlignerPublisher:W. H. Freeman
 Introduction to the Practice of StatisticsStatisticsISBN:9781319013387Author:David S. Moore, George P. McCabe, Bruce A. CraigPublisher:W. H. Freeman