
Mathematical Statistics with Applications
7th Edition
ISBN: 9781133384380
Author: Dennis Wackerly; William Mendenhall; Richard L. Scheaffer
Publisher: Cengage Learning US
expand_more
expand_more
format_list_bulleted
Videos
Textbook Question
Chapter 11.4, Problem 19E
A study was conducted to determine the effects of sleep deprivation on subjects’ ability to solve simple problems. The amount of sleep deprivation varied over 8, 12, 16, 20, and 24 hours without sleep. A total of ten subjects participated in the study, two at each sleep-deprivation level. After his or her specified sleep-deprivation period, each subject was administered a set of simple addition problems, and the number of errors was recorded. The results shown in the following table were obtained.
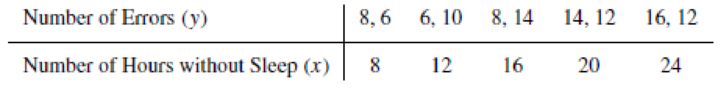
- a Find the least-squares line appropriate to these data.
- b Plot the points and graph the least-squares line as a check on your calculations.
- c Calculate S2.
Expert Solution & Answer
Want to see the full answer?
Check out a sample textbook solution
Students have asked these similar questions
The following data represent the results of a repeated-measures study comparing different viewing distances for a 42-inch-high-definition television. Four viewing distances were evaluated, 9 feet, 12 feet, 15 feet, and 18 feet. Each participant was free to move back and forth among the four distances while watching a 30-minute video on the television. The only restriction was that each person had to spend at least 2 minutes watching from each of the four distances. At the end of the video, each participant rated the all off of the viewing distances on a scale from 1 (very bad, definitely need to move closer or father way) to 7 (excellent, perfect viewing distance).
Use a repeated-measures ANOVA with alpha = 0.05 to determine whether there is significant difference among the four viewing distances.
A psychologist would like to examine the effects of a new drug on the activity level of animals. Three samples of rats are selected with n = 5 in each sample.
The rats in the first sample serve as a control and do not get any of the drug. The rats in the second group receive a small dose, and the rats in the third group
each get a large dose of the drug. The psychologist records the activity level for each animal. The data from this experiment are presented below.
no drug
small dose
large dose
2201O
22321
Complete the F-ratio table below.
Source of Variance
SS
Between Groups
Within Groups
Total
53223
df
MS
F
P-value
Psychologists at Disney World measured factors that affect the scariness of the soundtrack for their Haunted House
ride. In particular, they were interested in the loudness of the screams (soft versus loud) and the length of the screams
(short versus long). They used a 2 × 2 factorial design to test how these factors combined. They collected data from
10 different riders in each of the four conditions. Each rider rated the scariness of the ride on a nine-point scale.
short screams
long screams
soft screams
T=38, n = 10, SS = 13.6
T=64, n = 10, SS = 22.4
loud screams
T=52, n=10, SS = 29.6
T=50, n=10, SS = 16.0
For these data: G = 204, N = 40, X2 = 1156.
1. Sketch a dataplot of the mean rating in each condition.
2. Calculate SS total, the total sum of squares
3. Calculate SSwithin, the within-treatments sum of squares.
4. Calculate SSbetween, the between-treatments sum of squares.
5. Calculate SSA the sum of squares for Factor A (length of scream).
6. Calculate SSB, the sum of squares…
Chapter 11 Solutions
Mathematical Statistics with Applications
Ch. 11.3 - If 0 and 1 are the least-squares estimates for the...Ch. 11.3 - Prob. 2ECh. 11.3 - Fit a straight line to the five data points in the...Ch. 11.3 - Auditors are often required to compare the audited...Ch. 11.3 - Prob. 5ECh. 11.3 - Applet Exercise Refer to Exercises 11.2 and 11.5....Ch. 11.3 - Prob. 7ECh. 11.3 - Laboratory experiments designed to measure LC50...Ch. 11.3 - Prob. 9ECh. 11.3 - Suppose that we have postulated the model...
Ch. 11.3 - Some data obtained by C.E. Marcellari on the...Ch. 11.3 - Processors usually preserve cucumbers by...Ch. 11.3 - J. H. Matis and T. E. Wehrly report the following...Ch. 11.4 - a Derive the following identity:...Ch. 11.4 - An experiment was conducted to observe the effect...Ch. 11.4 - Prob. 17ECh. 11.4 - Prob. 18ECh. 11.4 - A study was conducted to determine the effects of...Ch. 11.4 - Suppose that Y1, Y2,,Yn are independent normal...Ch. 11.4 - Under the assumptions of Exercise 11.20, find...Ch. 11.4 - Prob. 22ECh. 11.5 - Use the properties of the least-squares estimators...Ch. 11.5 - Do the data in Exercise 11.19 present sufficient...Ch. 11.5 - Use the properties of the least-squares estimators...Ch. 11.5 - Let Y1, Y2, . . . , Yn be as given in Exercise...Ch. 11.5 - Prob. 30ECh. 11.5 - Using a chemical procedure called differential...Ch. 11.5 - Prob. 32ECh. 11.5 - Prob. 33ECh. 11.5 - Prob. 34ECh. 11.6 - For the simple linear regression model Y = 0 + 1x...Ch. 11.6 - Prob. 36ECh. 11.6 - Using the model fit to the data of Exercise 11.8,...Ch. 11.6 - Refer to Exercise 11.3. Find a 90% confidence...Ch. 11.6 - Refer to Exercise 11.16. Find a 95% confidence...Ch. 11.6 - Refer to Exercise 11.14. Find a 90% confidence...Ch. 11.6 - Prob. 41ECh. 11.7 - Suppose that the model Y=0+1+ is fit to the n data...Ch. 11.7 - Prob. 43ECh. 11.7 - Prob. 44ECh. 11.7 - Prob. 45ECh. 11.7 - Refer to Exercise 11.16. Find a 95% prediction...Ch. 11.7 - Refer to Exercise 11.14. Find a 95% prediction...Ch. 11.8 - The accompanying table gives the peak power load...Ch. 11.8 - Prob. 49ECh. 11.8 - Prob. 50ECh. 11.8 - Prob. 51ECh. 11.8 - Prob. 52ECh. 11.8 - Prob. 54ECh. 11.8 - Prob. 55ECh. 11.8 - Prob. 57ECh. 11.8 - Prob. 58ECh. 11.8 - Prob. 59ECh. 11.8 - Prob. 60ECh. 11.9 - Refer to Example 11.10. Find a 90% prediction...Ch. 11.9 - Prob. 62ECh. 11.9 - Prob. 63ECh. 11.9 - Prob. 64ECh. 11.9 - Prob. 65ECh. 11.10 - Refer to Exercise 11.3. Fit the model suggested...Ch. 11.10 - Prob. 67ECh. 11.10 - Fit the quadratic model Y=0+1x+2x2+ to the data...Ch. 11.10 - The manufacturer of Lexus automobiles has steadily...Ch. 11.10 - a Calculate SSE and S2 for Exercise 11.4. Use the...Ch. 11.12 - Consider the general linear model...Ch. 11.12 - Prob. 72ECh. 11.12 - Prob. 73ECh. 11.12 - An experiment was conducted to investigate the...Ch. 11.12 - Prob. 75ECh. 11.12 - The results that follow were obtained from an...Ch. 11.13 - Prob. 77ECh. 11.13 - Prob. 78ECh. 11.13 - Prob. 79ECh. 11.14 - Prob. 80ECh. 11.14 - Prob. 81ECh. 11.14 - Prob. 82ECh. 11.14 - Prob. 83ECh. 11.14 - Prob. 84ECh. 11.14 - Prob. 85ECh. 11.14 - Prob. 86ECh. 11.14 - Prob. 87ECh. 11.14 - Prob. 88ECh. 11.14 - Refer to the three models given in Exercise 11.88....Ch. 11.14 - Prob. 90ECh. 11.14 - Prob. 91ECh. 11.14 - Prob. 92ECh. 11.14 - Prob. 93ECh. 11.14 - Prob. 94ECh. 11 - At temperatures approaching absolute zero (273C),...Ch. 11 - A study was conducted to determine whether a...Ch. 11 - Prob. 97SECh. 11 - Prob. 98SECh. 11 - Prob. 99SECh. 11 - Prob. 100SECh. 11 - Prob. 102SECh. 11 - Prob. 103SECh. 11 - An experiment was conducted to determine the...Ch. 11 - Prob. 105SECh. 11 - Prob. 106SECh. 11 - Prob. 107SE
Knowledge Booster


Learn more about
Need a deep-dive on the concept behind this application? Look no further. Learn more about this topic, statistics and related others by exploring similar questions and additional content below.Similar questions
- why the correct answer is letter D and why the letters C and E are wrong?arrow_forwardA psychologist would like to examine the effects of diet on intelligence. Two groups of rats are selected, with 12 rats in each group. One group is fed the regular diet of RAT CHOW, whereas the second group has their diet enhanced by the addition of special vitamins. After 6 months, each rat is tested on a discrimination task. The psychologist records the number of errors made by each rat before it solves the problem. The data from this experiment is as follows: Diet µ σ Score Regular diet 11.58 1.9 12 Special 8.25 1.35 15 Change each rat’s score to its z-score equivalent On which diet did the rat score in the highest position? On which diet did the rats score in the lowest position? What is the percentile rank of the rat’s error on a special? What percentage of the rats who had the regular diet scored higher than the score? Between what two scores on special diet did the middle 95% of rats lie? What percent of rats had scores between X = 9…arrow_forwardA certain virus affects 0.4% of the population. A test used to detect the virus in a person is positive 90% of the time if the person has the virus (true positive) and 10% of the time if the person does not have the virus (false positive). Fill out the remainder of the following table and use it to answer the two questions below based on a total sample of 100,000 people. Virus No Virus Total Positive Test Negative Test Total 100,000 a) Find the probability that a person has the virus given that they have tested positive. Round your answer to the nearest hundredth of a percent and do not include a percent sign. % b) Find the probability that a person does not have the virus given that they test negative. Round your answer to the nearest hundredth of a percent and do not include a percent sign. %arrow_forward
- A researcher is interested in whether a new antidepressant drug D has an effect on people's self-rating of depression. She randomly assigns 12 people into two groups so that each group has 6 people. One group is given drug D daily, and the other group is not given drug D. Call these the Drug group and the No Drug group, respectively. After one month of treatment, all 12 people were asked to rate on a scale from 1 to 7 how depressed they felt, where 1 = not depressed at all and 7 = very depressed. The following are the data: Drug No Drug 2 4 3 5 4 5 4 4 2 6 3 6 nD = 6 nND = 6 MD = 3 MND = 5 sD = 0.89 sND = 0.89 Using an α-level of .05, perform a two-tailed t-test to determine whether there was an effect of Drug D on depression ratings. Specifically, answer the following questions: What is the total degrees of freedom for this problem? Calculate the standard error of the…arrow_forwardAn experiment is conducted to investigate the toxic effect of three chemicals, A, B, and C on the skin of rats. Three adjacent 1-inch squares are marked on the backs of 8 rats and each of the 3 chemicals is applied to each rat. The squares of the skin are then scored from 0 to 10, depending on the degree of irritation. The data on the outcome of the experiment are given in the following table: Rat 1 2 3 4 5 7 1.0 A B C| Rank A Rank B Rank C 6 5 3 11.5 6.0 1.5 9 8 4 23.0 20.0 3.0 6 11.5 23.0 1.5 6.0 20.0 11.5 16.5 20.0 23.0 6.0 16.5 11.5 11.5 16.5 6.0 11.5 6.0 16.5 5 6 7 8 Σyi 1.0 9 3 8 6 8 9 7 6 7 5 7 50 57 43 10 5 6 6 5 10 For the original data set 1-1 ij = 150, and ₁1-13 = 1006. From the ranks of the original data set the rank sums are RA = 97.5, RB = 128, Rc = 74.5 respectively. At a = 1%, is there sufficient evidence to support the research hypothesis that the probability distributions of skin irritation scores for the 3 chemicals differ in location? (a) Stating relevant…arrow_forwardA researcher is comparing the effectiveness of two sets of instructions for assembling a child’s bike. A sample of eight fathers is obtained. Half of the fathers are given one set of instructions and the other half receives the second set. The researcher measures how much time is needed for each father to assemble the bike. The scores are the number of minutes needed by each participant. Instruction Set I Instruction Set II 8 14 4 10 8 6 4 10 Is there a significant difference in time for the two sets of instructions? Use a two-tailed test at the .05 level of significance. What is the computed value? What would be the null hypothesis in this study? What would be the alternate hypothesis? What probability level did you choose and why? What is your p-value? Is there a significant difference between the two groups? Interpret your answer. If you have made an error, would it be a Type I or a Type II error? Explain your answer.arrow_forward
- A clinical psychologist wants to test the effectiveness of three new therapies that have been developed for reducing anxiety symptoms. The researcher recruits 15 participants and randomly assigns them to take part in Therapy A, Therapy B, or Therapy C for a month. At the end of the month, the researcher measures the participants' anxiety symptoms on a scale from 1 to 10 (where a higher score means more anxiety symptoms). The participants' scores are shown below: What is the appropriate test to use ? 3. What are the null and alternative hypotheses ? 4. Using a two-tailed alpha of .05, determine what the critical value is 5. Calculate the test statistic 6. State whether you reject or fail to reject the null hypothesis for the omnibus test 7. Calculate and report the effect size for the omnibus test 8. Perform a Post-Hoc Test. Report the significance of each pairwise comparisonarrow_forwardSanta was interested in increasing toy productivity. He randomly assigned elves into 2 separate groups. In one group elves were given some special "go juice" (i.e., maple syrup) and in the other group they had candy cane flavored water. After a week, Santa measured toy productivity across the 2 groups. What test would Santa use to see if drink type (go juice vs, candy cane water) resulted in differences in toy productivity?arrow_forwardA study on caffeine asked volunteers to take a recall test 2 hours after drinking a carbonated drink. Some drank caffeine-free, some drank regular, and others drank a mixture of the two (getting a half-dose of caffeine). The 5-number summaries for each group's scores (number of items recalled correctly) on the memory test are shown below. Complete parts a through d. n Min Q1 Median Q3 Max No Caffeine 15 17 18 21 24 26 Low Caffeine 15 17 18 20 23 25 High Caffeine 15 12 16 19 20 23 a) Describe the W's for these data. b) Name the variables and classify each as categorical or quantitative. c) Create side-by-side boxplots to display these results as best you can with this information. d) Write a few sentences comparing the performances of the three groups. The participants scored about the same with____________The medians for these two groups…arrow_forward
- A study is conducted to determine the effect of walnuts on concentration. Subjects were given 1 tablespoon of walnuts and asked to perform a memory test. Scores for the test were recorded in Excel. What is tool in this scenario?arrow_forwardA company wishes to evaluate the effect of package design on one of its products, a certain brand of cereal. The four package designs are to be tested in different stores throughout a large city. There are 20 stores available for the study. The amount of cereal sold is known to vary depending on the size of the stores. The 20 stores are divided into five groups of four stores each by size. The following sales figures ($1000s) were obtained after a 1-month period. Stores Design A Design B Design C Design D 1 40 33 37 38 2 45 27 32 40 3 43 31 30 41 4 44 38 40 42 5 56 45 49 42 Enter the above data into a suitable software and then conduct an analysis of variance without blocking to test whether there is evidence of a significant difference in mean sales of different package designs. Use alpha = 0.01. What are the mean squares for error? Please provide your answer to the nearest two decimal places.arrow_forwardA company wishes to evaluate the effect of package design on one of its products, a certain brand of cereal. The four package designs are to be tested in different stores throughout a large city. There are 20 stores available for the study. The amount of cereal sold is known to vary depending on the size of the stores. The 20 stores are divided into five groups of four stores each by size. The following sales figures ($1000s) were obtained after a 1-month period. Stores Design A Design B Design C Design D 1 40 33 37 38 O 0.0642 and 0.0435 2 0.0642 and 0.0038 O 0,0435 and 0.0028 0.0038 and 0.0028 45 0.0028 and 0.0038 27 32 40 3 43 31 30 41 4 44 38 40 42 5 56 45 Enter the above data into a suitable software and then conduct an analysis of variance with blocking (analyze this data as a complete block design) to test further whether there is evidence of a significant difference in mean sales of different package designs. Use alpha=0.01. 49 What are p-values to determine whether all…arrow_forward
arrow_back_ios
SEE MORE QUESTIONS
arrow_forward_ios
Recommended textbooks for you
 Glencoe Algebra 1, Student Edition, 9780079039897...AlgebraISBN:9780079039897Author:CarterPublisher:McGraw Hill
 Holt Mcdougal Larson Pre-algebra: Student Edition...AlgebraISBN:9780547587776Author:HOLT MCDOUGALPublisher:HOLT MCDOUGAL
Glencoe Algebra 1, Student Edition, 9780079039897...
Algebra
ISBN:9780079039897
Author:Carter
Publisher:McGraw Hill
Holt Mcdougal Larson Pre-algebra: Student Edition...
Algebra
ISBN:9780547587776
Author:HOLT MCDOUGAL
Publisher:HOLT MCDOUGAL
Finite State Machine (Finite Automata); Author: Neso Academy;https://www.youtube.com/watch?v=Qa6csfkK7_I;License: Standard YouTube License, CC-BY
Finite State Machine (Prerequisites); Author: Neso Academy;https://www.youtube.com/watch?v=TpIBUeyOuv8;License: Standard YouTube License, CC-BY