
Concept explainers
Videos
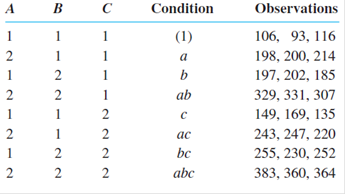
The accompanying data resulted from a 23 experiment with three replications per combination of treatments designed to study the effects of concentration of detergent (A), concentration of sodium carbonate (B), and concentration of sodium carboxymethyl cellulose (C) on the cleaning ability of a solution in washing tests (a larger number indicates better cleaning ability than a smaller number).
Factor Levels
- a. After obtaining cell totals xijk., compute estimates of β1,
- b. Use the cell totals along with Yates’s method to compute the effect contrasts and sums of squares. Then construct an ANOVA table and test all appropriate hypotheses using α = .05.
- c. Suppose a low water temperature has been used to obtain the data. The entire experiment is then repeated with a higher water temperature to obtain the following data. Use Yates’s algorithm on the entire set of 48 observations to obtain the sums of squares and ANOVA table, and then test appropriate hypotheses at level .05.
| Condition | Observations |
| d | 144, 154, 158 |
| ad | 239, 227, 244 |
| bd | 232, 242, 246 |
| abd | 364, 362, 346 |
| cd | 194, 162, 203 |
| acd | 284, 295,291 |
| bed | 291, 287, 297 |
| abed | 411,406, 395 |
a.
Compute the estimates of
Answer to Problem 39E
The estimates of
Explanation of Solution
Given info:
Inan
Calculation:
Yates method:
- Write the combination of treatments in the standard order in the beginning of the table called treatment column.
- Find the total effect obtained from each treatment combination and write it in the second column
- Find columns
- 1. Calculate column
- 2. Upper half is obtained by adding the pairs of values in the column
- 3. Lower half is obtained by taking the differences in pairs. That is, by subtracting the first value of pairs with the second value.
- 4. Similarly the columns
- Finally, this process is repeated for n times in
- Sum of squares due to contrast is obtained by using the formula given below:
The table below shows the Yates method of computation for the given data:
|
Treatment (1) |
(2) |
1 (3) |
2 (4) |
Effect contrast (5) |
(6) |
| 315 | 927 | 2,478 | 5,485 | ||
| 612 | 1,551 | 3,007 | 1,307 | 71,177.04 | |
| 584 | 1,163 | 680 | 1,305 | 70,959.38 | |
| 967 | 1,844 | 627 | 199 | 1,650.042 | |
| 453 | 297 | 624 | 529 | 11,660.04 | |
| 710 | 383 | 681 | –53 | 117.0417 | |
| 737 | 257 | 86 | 57 | 135.375 | |
| 1,107 | 370 | 113 | 27 | 30.375 |
Where,
The column
For
For
Similarly the remaining values are obtained.
The column (3) named as 1 is calculated by using the following method:
For
The same method is followed for the remaining 7 rows.
The second half of column (3) named as 1is calculated by find the differences in pairs of values from the column (2) named as
Then,
The fourth column named as 2, fifth column named as 3 and sixth column named as effect contrast were also calculated by using the method as given above.
Finally, the
The general formula for SS is
Thus, the value of
As,
Thus, the value of
b.
Compute the effect contrasts and sum of squares.
Construct the ANOVA table and test all the hypotheses using 5% level of significance.
Answer to Problem 39E
The effect contrasts and sum of squares are given below:
|
Treatment (1) |
Effect contrast (5) |
(6) |
| 5,485 | ||
| 1,307 | 71,177.04 | |
| 1,305 | 70,959.38 | |
| 199 | 1,650.042 | |
| 529 | 11,660.04 | |
| –53 | 117.0417 | |
| 57 | 135.375 | |
| 27 | 30.375 | |
| Total | 155,729.29 |
The ANOVA table is given below:
| Effect | Degrees of freedom | Sum of squares | Mean sum of squares | F-ratio |
| 1 | 71,177.04 | 71,177.04 | 436.56 | |
| 1 | 70,959.38 | 70,959.38 | 435.23 | |
| 1 | 1,650.042 | 1,650.042 | 10.12 | |
| 1 | 11,660.04 | 11,660.04 | 71.52 | |
| 1 | 117.0417 | 117.0417 | 0.72 | |
| 1 | 135.375 | 135.375 | 0.83 | |
| 1 | 30.375 | 30.375 | 0.19 | |
| Error | 16 | 2,608.7 | 163.04 | |
| Total | 48 | 158,337.6 |
There is sufficient evidence to conclude that at least one of the main or the interaction effects is significant at 5% level of significance and those significant effects are A, B, C, D and AB.
Explanation of Solution
Given info:
Use the Yates table.
Calculation:
The effect contrasts and sum of squares are given below:
|
Treatment (1) |
(2) |
1 (3) |
2 (4) |
Effect contrast (5) |
(6) |
| 315 | 927 | 2,478 | 5,485 | ||
| 612 | 1,551 | 3,007 | 1,307 | 71,177.04 | |
| 584 | 1,163 | 680 | 1,305 | 70,959.38 | |
| 967 | 1,844 | 627 | 199 | 1,650.042 | |
| 453 | 297 | 624 | 529 | 11,660.04 | |
| 710 | 383 | 681 | –53 | 117.0417 | |
| 737 | 257 | 86 | 57 | 135.375 | |
| 1,107 | 370 | 113 | 27 | 30.375 | |
| Total | 155,729.29 |
Effect contrast is calculated by adding the numbers in pairs for the first half values and finding the difference in pairs for the remaining half values from the column (4).
For first half,
Similar method is following for the remaining pairs.
For second half,
Similar method is following for the remaining pairs.
The
The general formula for SS is
Total sum of squares is calculated as follows:
Substitute
Thus, the SST is 158,337.96.
Sum of squares due to error is calculated as follows:
Thus, the sum of squares due to error is 2,608.7.
Mean sum of squares is calculated as follows:
Thus, the mean sum of squares is 163.04.
The ANOVA table is given below:
| Effect | Degrees of freedom | Sum of squares | Mean sum of squares | F-ratio |
| 1 | ||||
| 1 | 71,177.04 | 71,177.04 | 436.56 | |
| 1 | 70,959.38 | 70,959.38 | 435.23 | |
| 1 | 1,650.042 | 1,650.042 | 10.12 | |
| 1 | 11,660.04 | 11,660.04 | 71.52 | |
| 1 | 117.0417 | 117.0417 | 0.72 | |
| 1 | 135.375 | 135.375 | 0.83 | |
| 1 | 30.375 | 30.375 | 0.19 | |
| Error | 16 | 2,608.7 | 163.04 | |
| Total | 48 | 158,337.6 |
Testing the hypotheses:
Null hypothesis:
Alternative hypothesis:
Critical value:
Software procedure:
Step-by-step procedure to obtain the critical value is given below:
- Click on Graph, select View Probability and click OK.
- Select F, enter 1 in numerator df and 16 in denominator df.
- Under Shaded Area Tab select Probability under Define Shaded Area By and select right tail.
- Choose Probability as 0.05.
- Click OK.
Output obtained from MINITAB is given below:
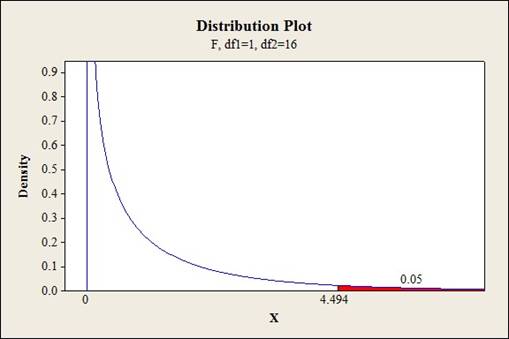
Thus, the critical value is 4.494.
Conclusion:
The test statisticfor all the main effects and interaction AB is greater than the critical value is 4.494.
The test statisticis greaterthan the critical value.
Thus, the null hypothesis is rejected.
Hence, there is sufficient evidence to conclude that at least one of the main or the interaction effects is significant at 5% level of significance and those significant effects are A, B, C, D and AB.
Also, the remaining factors AC, BC and ABC are not significant at 5% level of significance.
c.
Construct the ANOVA table and test all the hypotheses using 1% level of significance.
Answer to Problem 39E
The ANOVA table is given below:
| Effect | Degrees of freedom | Sum of squares | Mean sum of squares | F-ratio |
| 1 | ||||
| 1 | 136,640 | 136,640 | 749.48 | |
| 1 | 139,644.2 | 139,644.2 | 765.96 | |
| 1 | 2,173.521 | 2,173.521 | 11.92 | |
| 1 | 24,616.02 | 24,616.02 | 135.02 | |
| 1 | 2.520833 | 2.520833 | 0.01 | |
| 1 | 165.0208 | 165.0208 | 0.91 | |
| 1 | 42.1875 | 42.1875 | 0.23 | |
| 1 | 20,377.52 | 20,377.52 | 111.77 | |
| 1 | 58.52083 | 58.52083 | 0.32 | |
| 1 | 9.1875 | 9.1875 | 0.05 | |
| 1 | 117.1875 | 117.1875 | 0.64 | |
| 1 | 17.52083 | 17.52083 | 0.1 | |
| 1 | 188.0208 | 188.0208 | 1.03 | |
| 1 | 13.02083 | 13.02083 | 0.07 | |
| 1 | 204.1875 | 204.1875 | 1.12 | |
| Error | 32 | 5,834.024 | 182.313 | |
| Total | 48 |
There is sufficient evidence to conclude that at least one of the main or the interaction effects is significant at 5% level of significance and those significant effects are A, B, C, D and AB.
Explanation of Solution
Given info:
A fourth factor called low water temperature is added to the given data and its effects are observed.
Calculation:
The table below shows the Yates method of computation for the given data:
|
Condition (1) |
(2) |
1 (3) |
2 (4) |
3 (5) |
Effect contrast (6) |
(7) |
| 315 | 927 | 2,478 | 5,485 | 11,959 | ||
| 612 | 1,551 | 3,007 | 6,474 | 2561 | 136,640 | |
| 584 | 1,163 | 2,958 | 1,307 | 2589 | 139,644.2 | |
| 967 | 1,844 | 3,516 | 1,254 | 323 | 2,173.521 | |
| 453 | 1,166 | 680 | 1,305 | 1087 | 24,616.02 | |
| 710 | 1,792 | 627 | 1,284 | –11 | 2.520833 | |
| 737 | 1,429 | 606 | 199 | 89 | 165.0208 | |
| 1,107 | 2,087 | 648 | 124 | –45 | 42.1875 | |
| 456 | 297 | 624 | 529 | 989 | 20,377.52 | |
| 710 | 383 | 681 | 558 | –53 | 58.52083 | |
| 720 | 257.00 | 626.00 | –53.00 | –21.00 | 9.1875 | |
| 1,072 | 370.00 | 658.00 | 42.00 | –75.00 | 117.1875 | |
| 559 | 254.00 | 86.00 | 57.00 | 29.00 | 17.52083 | |
| 870 | 352.00 | 113.00 | 32.00 | 95.00 | 188.0208 | |
| 875 | 311 | 98 | 27 | –25 | 13.02083 | |
| 1,212 | 337 | 26 | –72 | –99 | 204.1875 | |
| Total | 324,268.646 |
All the calculations are same as given in part (a) but there is addition of extra rows because a factor D is added to the experiment.
Finally, the
The general formula for SS is
Total sum of squares is calculated as follows:
Substitute
Sum of squares due to error is calculated as follows:
Thus, the sum of squares due to error is 5,834.024.
Mean sum of squares is calculated as follows:
Thus, the mean sum of squares is 182.313.
The ANOVA table is given below:
| Effect | Degrees of freedom | Mean sum of squares | F-ratio |
| 1 | |||
| 1 | 136,640 | 749.48 | |
| 1 | 139,644.2 | 765.96 | |
| 1 | 2,173.521 | 11.92 | |
| 1 | 24,616.02 | 135.02 | |
| 1 | 2.520833 | 0.01 | |
| 1 | 165.0208 | 0.91 | |
| 1 | 42.1875 | 0.23 | |
| 1 | 20,377.52 | 111.77 | |
| 1 | 58.52083 | 0.32 | |
| 1 | 9.1875 | 0.05 | |
| 1 | 117.1875 | 0.64 | |
| 1 | 17.52083 | 0.1 | |
| 1 | 188.0208 | 1.03 | |
| 1 | 13.02083 | 0.07 | |
| 1 | 204.1875 | 1.12 | |
| Error | 32 | 182.313 | |
| Total | 48 |
Testing the hypothesis:
Null hypothesis:
Alternative hypothesis:
Critical value:
Software procedure:
Step-by-step procedure to obtain the critical value is given below:
- Click on Graph, select View Probability and click OK.
- Select F, enter 1 in numerator df and 32 in denominator df.
- Under Shaded Area Tab select Probability under Define Shaded Area By and select right tail.
- Choose Probability as 0.05.
- Click OK.
Output obtained from MINITAB is given below:
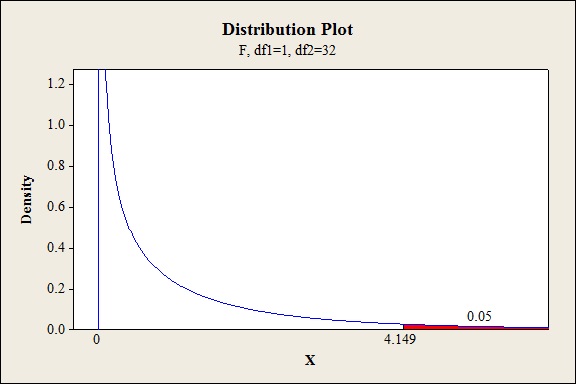
Thus, the critical value is 4.149.
Conclusion:
The test statistic for all the main effects and interaction AB is greater than the critical value is 4.494.
The test statisticis greater than the critical value.
Thus, the null hypothesis is rejected.
Hence, there is sufficient evidence to conclude that at least one of the main or the interaction effects is significant at 5% level of significance and those significant effects are A, B, C, D and AB.
Also, the remaining factors AC, BC and ABC are not significant at 5% level of significance.
Want to see more full solutions like this?
Chapter 11 Solutions
Probability and Statistics for Engineering and the Sciences


- . A new chemotherapy drug is released to treat leukemia and researchers suspect that the drug may have fewer side effects than the most commonly used drug to treat leukemia. The two drugs have equivalent efficacy. In order to determine if a larger study should be conducted to look into the prevalence of side effects for the two drugs, set up a Mann-Whitney U test at the alpha equals .05 level and interpret its results. Number of Reported Side-EffectsOld Drug 0 1 1 3 5New Drug 0 0 1 2 4 Old Drug New Drug Total Sample(Ordered Smallest to Largest) RanksOld Drug New Drug Old Drug New DrugR1= R2= A) We reject H0 in favor of H1, which states the two populations are not equal at the alpha equals .05 level because the calculated U value of 10 is greater than the critical U value of 2.B) We reject H0 in favor of H1, which states the two populations are not equal at the alpha equals .05 level because the calculated U value of 8.5 is greater than the critical U value of 2.C) We fail to reject H0,…arrow_forwardThe ecologist studying the effects of phytohormones (auxin and cytokinin) on tumor induction in plants by insects, performed an experiment to determine if the form of the cytokinin affected the growth of tumors. She performed treatments each with the same total cytokinin and auxin concentrations, but with individual or mixtures of a few cytokinins (TZ – trans-zeatin, CZ - cis-zeatin, IP – isopentenyl adenosine, and IAA - indole acetic acid). Treatment 1 had auxin (IAA) alone so is not pertinent to the questions asked here, treatment 6 had TZ + IAA, treatment 17 had IP + IAA, treatment 18 had TZ+IP +IAA, treatment 19 had CZ + IAA, and treatment 20 had TZ+CZ+IP+IAA. Perform a priori contrasts comparing the effects of treatments with IP to treatments without IP and treatments with TZ to treatments with CZ (no treatments with both TZ and CZ). Use the data in the file "cytokinin.csv". (Note: Beware of missing value on row 13..) cytokinin data Treatment sumdiff 1 1 0.02063830 2 1…arrow_forwardA new chemotherapy drug is released to treat leukemia and researchers suspect that the drug may have fewer side effects than the most commonly used drug to treat leukemia. The two drugs have equivalent efficacy. In order to determine if a larger study should be conducted to look into the prevalence of side effects for the two drugs, set up a Mann-Whitney U test at the alpha equals .05 level and interpret its results. Number of Reported Side-Effects Old Drug 0 1 3 3 5 New Drug 0 0 1 2 4 A) We fail to reject H0, which states the two populations are equal at the alpha equals .05 level because the calculated Uvalue of 16.5 is greater than the critical U value of 2. B) We fail to reject H0, which states the two populations are equal at the alpha equals .05 level because the calculated Uvalue of 8.5 is greater than the critical U value of 2. C) We reject H0 in favor of H1, which…arrow_forward
- A cream with alpha-hydroxy acid, advertises that it can reduce wrinkles and improve the skin. In a study published in Archives of Dermatology (June 1996), 49 middle-aged women used a cream with alpha-hydroxy acid for 22 weeks. At the end of the study period, a dermatologist judged whether each woman exhibited any improvement in the condition of her skin. The results for the 49 women (where I = improved skin and N = no improvement) were: 32 I’s and 17 N’s. (a) Find a 95% confidence interval for p, the true population proportion of middle-aged women with improved skin after using this cream. Interpret the interval. (b) What assumptions are required for the confidence interval of part (a) to be statistically valid? (c) Are the assumptions for part (b) reasonably satisfied? Explain.arrow_forwardFor 30 recent Academy Award ceremonies, ages of Best Supporting Actors (x) and ages of Best Supporting Actresses (y) are recorded. The 30 paired ages yield x = 52.1 years, y = 37.3 years, r = 0.076, P-value = 0.691, and yn = 34.4 + 0.0547x. Find the best predicted value of yn (age of Best Supporting Actress) in 1982, when the age of the Best Supporting Actor (x) was 46 years. Use a significance level of 0.05 A. Should this model be used for making predictions? Why or why not? B. Calculate the best predicted value of the age of the Best Supporting actress in 1982.arrow_forwardA new chemotherapy drug is released to treat leukemia and researchers suspect thst the drug may have fewer side effects than the most commonly used drug to treat leukemia. The two drugs have equivalent efficacy. In order to determine if a larger study should be conducted to look into the prevalence of side effects for the two drugs, set up a Mann-Whitney U test at the alpha equals .05 level and interpret its results. Number of reported side effects Old drug 0 1 3 3 5 New drug 0 0 1 2 4arrow_forward
- A new chemotherapy drug is released to treat leukemia and researchers suspect that the drug may have fewer side effects than the most commonly used drug to treat leukemia. The two drugs have equivalent efficacy. In order to determine if a larger study should be conducted to look into the prevalence of side effects for the two drugs, set up a Mann-Whitney U test at the alpha equals .05 level and interpret its results. Number of Reported Side-Effects Old Drug 0 1 1 3 5 New Drug 0 0 1 2 4 Old Drug New Drug Total Sample (Ordered Smallest to Largest) Ranks Old Drug New Drug Old Drug New Drug 0 0 0 0 2 2 1 0 0 2 1 1 1 1 3.7 3.7 3 2 1 3.7 5 4 2 7 3 8 4 9 5 10 R1=27.4 R2=23.7 A) We…arrow_forwardA new chemotherapy drug is released to treat leukemia and researchers suspect that the drug may have fewer side effects than the most commonly used drug to treat leukemia. The two drugs have equivalent efficacy. In order to determine if a larger study should be conducted to look into the prevalence of side effects for the two drugs, set up a Mann-Whitney U test at the alpha equals .05 level and interpret its results. Number of Reported Side-Effects Old Drug 0 1 1 3 5 New Drug 0 0 1 2 4 Old Drug New Drug Total Sample (Ordered Smallest to Largest) Ranks Old Drug New Drug Old Drug New Drug 0 0 0 0 2 2 1 0 0 2 1 1 1 1 5 5 3 2 1 5 5 4 2 7 3 8 4 9 5 10 R1=30 R2=25 We reject H0 in…arrow_forwardA new chemotherapy drug is released to treat leukemia and researchers suspect that the drug may have fewer side effects than the most commonly used drug to treat leukemia. The two drugs have equivalent efficacy. In order to determine if a larger study should be conducted to look into the prevalence of side effects for the two drugs, set up a Mann-Whitney Utest at the alpha equals .05 level and interpret its results. Number of Reported Side-Effects Old Drug 0 1 3 3 5 New Drug 0 0 1 2 4 Old Drug New Drug Total Sample (Ordered Smallest to Largest) Ranks Old Drug New Drug Old Drug New Drug A) We fail to reject H0, which…arrow_forward
- . A new chemotherapy drug is released to treat leukemia and researchers suspect that the drug may have fewer side effects than the most commonly used drug to treat leukemia. The two drugs have equivalent efficacy. In order to determine if a larger study should be conducted to look into the prevalence of side effects for the two drugs, set up a Mann-Whitney U test at the alpha equals .05 level and interpret its results. Number of Reported Side-Effects Old Drug 0 1 3 3 5 New Drug 0 0 1 2 4 Old Drug New Drug Total Sample (Ordered Smallest to Largest) Ranks Old Drug New Drug Old Drug New Drug 0 0 0 0 2 2 1 0 1 0 4.5 2 3 1 3 1 7.5 4.5 3 2 3 2 7.5 6 5 4 5 4 10 9 Total R1=31.5 R2=23.5 A) We…arrow_forwardA new chemotherapy drug is released to treat leukemia and researchers suspect that the drug may have fewer side effects than the most commonly used drug to treat leukemia. The two drugs have equivalent efficacy. In order to determine if a larger study should be conducted to look into the prevalence of side effects for the two drugs, set up a Mann-Whitney U test at the alpha equals .05 level and interpret its results. Number of Reported Side-Effects Old Drug 0 1 3 3 5 New Drug 0 0 1 2 4 Old Drug New Drug Total Sample (Ordered Smallest to Largest) Ranks Old Drug New Drug Old Drug New Drug A) We fail to reject H0, which…arrow_forwardThe appearance of leaf pigment glands in the seedling stage of cotton plants is genetically controlled. According to one theory of the control mechanism, the population ratio of glandular to glandless plants resulting from a certain cross should be 11.5, according to another it should be 13:3. In one experiment, the cross produced 89 glandular and 36 glandless plants. Use goodness-of-fit tests (at alpha= 0.10) to determine whether the data is consistent with a) the 11:5 theory, ar b) the 13:3 theory.arrow_forward
 MATLAB: An Introduction with ApplicationsStatisticsISBN:9781119256830Author:Amos GilatPublisher:John Wiley & Sons Inc
 Probability and Statistics for Engineering and th...StatisticsISBN:9781305251809Author:Jay L. DevorePublisher:Cengage Learning
 Statistics for The Behavioral Sciences (MindTap C...StatisticsISBN:9781305504912Author:Frederick J Gravetter, Larry B. WallnauPublisher:Cengage Learning
 Elementary Statistics: Picturing the World (7th E...StatisticsISBN:9780134683416Author:Ron Larson, Betsy FarberPublisher:PEARSON
 The Basic Practice of StatisticsStatisticsISBN:9781319042578Author:David S. Moore, William I. Notz, Michael A. FlignerPublisher:W. H. Freeman
 Introduction to the Practice of StatisticsStatisticsISBN:9781319013387Author:David S. Moore, George P. McCabe, Bruce A. CraigPublisher:W. H. Freeman