Statistics for Engineers and Scientists
4th Edition
ISBN: 9780073401331
Author: William Navidi Prof.
Publisher: McGraw-Hill Education
bartleby

Concept explainers

bartleby

Videos

Textbook Question
Book Icon
Chapter 1.2, Problem 10E

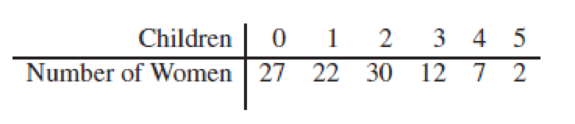
A sample of 100 adult women was taken, and each was asked how many children she had. The results were as follows:

Chapter 1.2, Problem 10E, A sample of 100 adult women was taken, and each was asked how many children she had. The results

  1. a. Find the sample mean number of children.
  2. b. Find the sample standard deviation of the number of children.
  3. c. Find the sample median of the number of children.
  4. d. What is the first quartile of the number of children?
  5. e. What proportion of the women had more than the mean number of children?
  6. f. For what proportion of the women was the number of children more than one standard deviation greater than the mean?
  7. g. For what proportion of the women was the number of children within one standard deviation of the mean?

a.

Expert Solution
Check Mark
To determine

Find the sample mean number of children.

Answer to Problem 10E

The sample mean number of children is 1.56.

Explanation of Solution

Given info:

The data shows number of children and number of women.

Calculation:

The total of the results for the given data is,

ChildrenNumber of Women
027
122
230
312
47
52
Total100

Sample mean:

Let X1,X2,..,Xn be the sample then the sample mean is,

X¯=1ni=1nXi

The sample size n is 100.

The formula for finding the sample mean number of children is,

X¯=1100i=1100Xi=1100(27(0)+22(1)+30(2)+12(3)+7(4)+2(5))=1100(22+60+36+28+10)=156100

=1.56

Thus, the sample mean number of children is 1.56.

b.

Expert Solution
Check Mark
To determine

Find the sample standard deviation of the number of children.

Answer to Problem 10E

The sample standard deviation of the number of children is 1.3051.

Explanation of Solution

Calculation:

Sample variance:

Let X1,X2,..,Xn be the sample then the sample variance is,

s2=1n1(i=1nXi2nX¯2)

The sample variance of the number of children is obtained as follows:

s2=11001(i=1100Xi2100X¯2)=199(27(0)2+22(1)2+30(2)2+12(3)2+7(4)2+2(5)2100(1.56)2)=199(22+120+108+112+50243.36)=168.6499

=1.7034

Thus, the sample variance of the number of children is 1.7034.

The formula for finding the sample standard deviation of the number of children is,

s=s2=1.7034=1.3051

Thus, the sample standard deviation of the number of children is 1.3051.

c.

Expert Solution
Check Mark
To determine

Find the sample median of the number of children.

Answer to Problem 10E

The sample median of the number of children is 2.

Explanation of Solution

Calculation:

Sample median:

If n numbers are ordered from smallest to largest:

  • If n is odd, the sample is the number in position n+12.
  • If n is even, the sample median is the average of the numbers in positions n2 and n2+1.

From the given data, it is observed that the sample median is the average of 50th and 51st value when arranged in order because the sample size n is 100.

Here, the value of 50th and 51st is 2.

Therefore, the average of 50th and 51st value is,

Median=2+22=2

Thus, the sample median of the number of children is 2.

d.

Expert Solution
Check Mark
To determine

Find the first quartile of the number of children.

Answer to Problem 10E

The first quartile of the number of children is 0.

Explanation of Solution

Calculation:

The first quartile is the average of the 25th and 26th value when arranged in order.

From the given data, it is observed that the 25th and 26th values are 0.

Therefore, the average of 25th and 26th value is,

First quartile=0+02=0

Thus, the first quartile of the number of children is 0.

e.

Expert Solution
Check Mark
To determine

Find the proportion of the women had more than the mean number of children.

Answer to Problem 10E

The proportion of the women had more than the mean number of children is 0.51.

Explanation of Solution

Calculation:

From part (a), the mean is 1.56 children.

The number of women had more than the mean number of children is 51 (=30+12+7+2).

The sample size n is 100.

The formula for finding the proportion of the women had more than the mean number of children is,

Proportion=Number of women had more than the mean number of childrenn=51100=0.51

Thus, the proportion of the women had more than the mean number of children is 0.51.

f.

Expert Solution
Check Mark
To determine

Find the proportion of the women was the number of children more than one standard deviation greater than the mean.

Answer to Problem 10E

The proportion of the women was the number of children more than one standard deviation greater than the mean is 0.21.

Explanation of Solution

Calculation:

From part (a), the mean is 1.56 children and from part (b), the standard deviation is 1.7034.

The quantity that is one standard deviation greater than the mean is,

X¯+s=1.56+1.3051=2.8651

The number of women was the number of children more than one standard deviation greater than the mean is 21 (=12+7+2).

The formula for finding the proportion of the women was the number of children more than one standard deviation greater than the mean is,

Proportion=(Number of women was the number of children more than one standard deviation greater than the mean)n=21100=0.21

Thus, the proportion of the women was the number of children more than one standard deviation greater than the mean is 0.21.

g.

Expert Solution
Check Mark
To determine

Find the proportion of the women was the number of children within one standard deviation of the mean.

Answer to Problem 10E

The proportion of the women was the number of children within one standard deviation of the mean is 0.52.

Explanation of Solution

Calculation:

From part (a), the mean is 1.56 children and from part (b), the standard deviation is 1.7034.

The quantity that is one standard deviation with in the mean is,

X¯s=1.561.3051=0.2549

X¯+s=1.56+1.3051=2.8651

The number of women was the number of children within one standard deviation of the mean is 52 (=22+30).

The formula for finding the proportion of the women was the number of children within one standard deviation of the mean is,

Proportion=(Number of women was the number of children within one standard deviation of the mean)n=52100=0.52

Thus, the proportion of the women was the number of children within one standard deviation of the mean is 0.52.

Want to see more full solutions like this?

Subscribe now to access step-by-step solutions to millions of textbook problems written by subject matter experts!

Chapter 1 Solutions

Statistics for Engineers and Scientists

Ch. 1.2 - Is the sample mean always the most frequently...Ch. 1.2 - Is the sample mean always equal to one of the...Ch. 1.2 - Is the sample median always equal to one of the...Ch. 1.2 - Find a sample size for which the median will...Ch. 1.2 - For a list of positive numbers, is it possible for...Ch. 1.2 - Is it possible for the standard deviation of a...Ch. 1.2 - In a certain company, every worker received a...Ch. 1.2 - In another company, every worker received a 5%...Ch. 1.2 - A sample of 100 adult women was taken, and each...Ch. 1.2 - In a sample of 20 men, the mean height was 178 cm....Ch. 1.2 - Each of 16 students measured the circumference of...Ch. 1.2 - Refer to Exercise 12. a. If the measurements for...Ch. 1.2 - There are 10 employees in a particular division of...Ch. 1.2 - Quartiles divide a sample into four nearly equal...Ch. 1.2 - In each of the following data sets, tell whether...Ch. 1.3 - The weather in Los Angeles is dry most of the...Ch. 1.3 - Forty-five specimens of a certain type of powder...Ch. 1.3 - Refer to Table 1.2 (in Section 1.2). Construct a...Ch. 1.3 - Following are measurements of soil concentrations...Ch. 1.3 - A certain reaction was run several times using...Ch. 1.3 - Sketch a histogram for which a. The mean is...Ch. 1.3 - The figure below is a histogram showing the...Ch. 1.3 - The histogram below presents the compressive...Ch. 1.3 - Refer to Table 1.4 (in Section 1.3). a. Using the...Ch. 1.3 - Refer to Table 1.5 (in Section 1.3). a. Using the...Ch. 1.3 - The following table presents the number of...Ch. 1.3 - Which of the following statistics cannot be...Ch. 1.3 - A sample of 100 resistors has an average...Ch. 1.3 - Following are boxplots comparing the amount of...Ch. 1.3 - Following are summary statistics for two data...Ch. 1.3 - Match each histogram to the box plot that...Ch. 1.3 - Prob. 17ECh. 1.3 - Match each scatterplot to the statement that best...Ch. 1.3 - Prob. 19ECh. 1 - A vendor converts the weights on the packages she...Ch. 1 - Refer to Exercise 1. The vendor begins using...Ch. 1 - The specification for the pull strength of a wire...Ch. 1 - A coin is tossed twice and comes up heads both...Ch. 1 - The smallest number on a list is changed from 12.9...Ch. 1 - There are 15 numbers on a list, and the smallest...Ch. 1 - There are 15 numbers on a list, and the mean is...Ch. 1 - The article The Selection of Yeast Strains for the...Ch. 1 - Concerning the data represented in the following...Ch. 1 - True or false: In any boxplot, a. The length of...Ch. 1 - For each of the following histograms, determine...Ch. 1 - In the article Occurrence and Distribution of...Ch. 1 - The article Vehicle-Arrival Characteristics at...Ch. 1 - The cumulative frequency and the cumulative...Ch. 1 - The article Hydrogeochemical Characteristics of...Ch. 1 - Water scarcity has traditionally been a major...Ch. 1 - Prob. 18SECh. 1 - The article The Ball-on-Three-Ball Test for...
Knowledge Booster
Background pattern image
Statistics
Learn more about
Need a deep-dive on the concept behind this application? Look no further. Learn more about this topic, statistics and related others by exploring similar questions and additional content below.
Recommended textbooks for you
Text book image
Glencoe Algebra 1, Student Edition, 9780079039897...
Algebra
ISBN:9780079039897
Author:Carter
Publisher:McGraw Hill
The Shape of Data: Distributions: Crash Course Statistics #7; Author: CrashCourse;https://www.youtube.com/watch?v=bPFNxD3Yg6U;License: Standard YouTube License, CC-BY
Shape, Center, and Spread - Module 20.2 (Part 1); Author: Mrmathblog;https://www.youtube.com/watch?v=COaid7O_Gag;License: Standard YouTube License, CC-BY
Shape, Center and Spread; Author: Emily Murdock;https://www.youtube.com/watch?v=_YyW0DSCzpM;License: Standard Youtube License