
Videos
a.
Obtain the null and the alternative hypotheses.
a.
Explanation of Solution
The null and alternative hypotheses are given below:
Null Hypothesis
That is, the mean of all treatments are equal.
Alternative Hypothesis
b.
Give the decision rule.
b.
Explanation of Solution
The treatment and error degrees of freedom are given below:
Treatment degrees of freedom:
Error degrees of freedom:
Here, the level of significance
Step-by-step procedure to obtain the critical F value using Excel-MegaStat:
- In EXCEL, Select Add-Ins > MegaStat > Probability.
- Choose probability> F-distribution> calculate F given probability.
- Enter P as 0.05.
- Enter df1 as 2.
- Enter df2 as 9.
- Click Ok.
Output using the Excel-MegaStat software is given below:
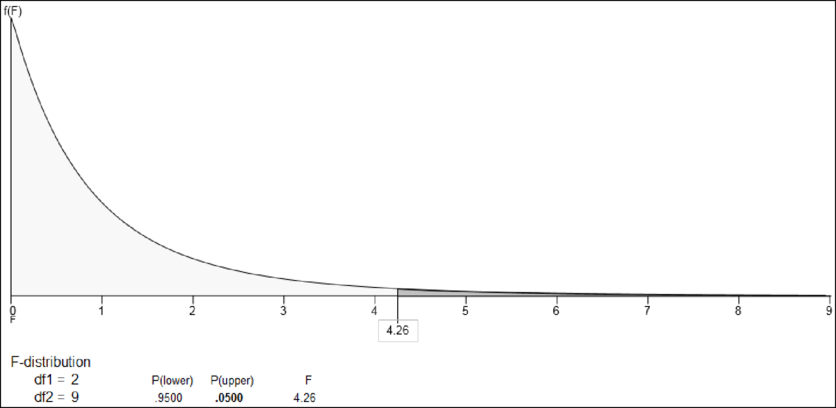
From the output, the critical F value is 4.26.
Decision rule:
If
Therefore, the decision rule is to reject
c.
Find the values of SST, SSE and SS total.
c.
Answer to Problem 11E
The value of SST is 107.20.
The value of SSE is 9.47.
The value of SS total is 116.67.
Explanation of Solution
Here, the level of significance
Step-by-step procedure to obtain the sum of square total, sum of square treatment and sum of square error using Excel-MegaStat:
- Choose MegStat > Analysis of Variance > One-Factor ANOVA.
- Select the column of Treatment 1, Treatment 2 and Treatment 3 in Input
range . - Click OK.
Output using the Excel-MegaStat software is given below:
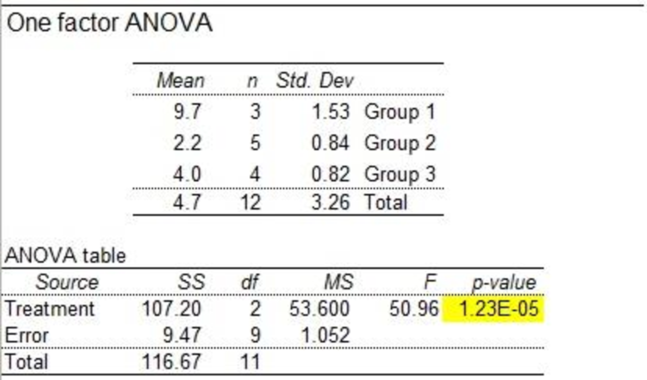
From the output, the values of SST is 107.20, SSE is 9.47 and SS total is 116.67.
d.
Find an ANOVA table.
d.
Explanation of Solution
From the output in Part (c), the ANOVA table is obtained.
The ANOVA table is given below:
| Source of Variation | Sum of Squares | Degrees of Freedom | Mean Square | F |
| Treatments | 107.2 | 2 | 53.6 | 50.96 |
| Error | 9.47 | 9 | 1.05 | |
| Total | 116.67 | 11 |
e.
Find the decision regarding the null hypothesis.
e.
Explanation of Solution
Conclusion:
The F value is 50.96 and the F critical value is 4.26.
Here, F value is greater than F critical value. That is, 50.96 > 4.26.
Using rejection rule, reject the null hypothesis.
Therefore, there is sufficient evidence that at least one mean of all treatment is differ from others.
f.
Check whether there is significant difference between treatment 1 and treatment 2, if null hypothesis is rejected by using the 95% level of confidence.
f.
Explanation of Solution
A 95% confidence interval is as follows:
Where,
From the output in Part (c), the mean of treatment 1 is 9.7, mean of treatment 2 is 2.2, and MSE is 1.052.
Step-by-step procedure to obtain t-critical value using Excel-MegaStat:
- In EXCEL, Select Add-Ins > MegaStat > Probability > t-Distribution.
- Select calculate t given P.
- Enter probability as 0.05.
- Enter df as 9.
- Under Shading, choose two-tail.
- Click Ok.
Output using the Excel-MegaStat software is given below:
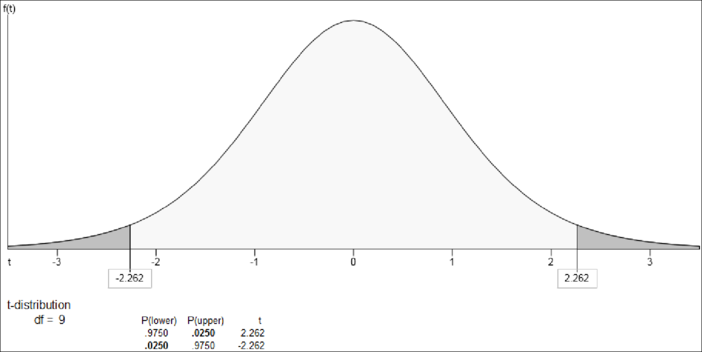
From the output, the t is
Therefore, a 95% confidence interval for that difference is 5.8 and 9.2. Here, 0 does not include in the confidence interval.
It means that there is a significant difference between the means of treatment 1 and treatment 2 because the endpoints have same sign or does not include zero.
Want to see more full solutions like this?
Chapter 12 Solutions
EBK STATISTICAL TECHNIQUES IN BUSINESS


- The following results are for two independent samples taken from the two populations. Sample 1 Sample 2 n1 = 40 n2 = 50 x-bar1 = 25.5 x-bar2 = 22.8 σ1 = 5.2 σ2 = 6.0 What is the value of the test statistic? What is the p-value? With α = 0.05, what is your hypothesis testing conclusion?arrow_forwardThe following data summarize the results from an independent-measures study comparing three treatment conditions. Treatment I II III N = 12 4 3 8 G = 48 3 1 4 ∑X2 = 238 5 3 6 4 1 6 x̅1 = 4 x̅2 = 2 x̅3 = 6 T1 = 16 T2 = 8 T3 = 24…arrow_forwardFind the value of the standard score, z, and determine whether the alternative hypothesis is supported or not supported at a 0.05 significance level.Ha: μ ≠ 18.7, n = 11, = 20.5, σ = 7arrow_forward
- Utilizing the previous table: A sample of 25 cities have been classified as high or low on their homicide rates and on the number of handguns sold within the city limits. Was the null hypothesis rejected or accepted?arrow_forwardIn one study subjects were randomly assigned to receive either 500 milligrams of vitamin C daily or a placebo, and the number of colds they came down with during a winter season was noted. In the second study people responded to a questionnaire asking about the average number of hours they sleep per night and the number of colds they came down with during a winter season. a. The first study was an observational study, while the second was a controlled experiment. b. The first study was a controlled experiment, while the second was an observational study. c. Both studies were controlled experiments. d. Both studies were observational studies.arrow_forwardIndependent random samples of 32 people living on the west side of a city and 30 people living on the east side of a city were taken to determine if the income levels of west side residents are significantly different from the income levels of east side residents. Given the testing statistics below, determine if the data provides sufficient evidence to conclude that the income levels of west side residents are significantly different from the income levels of east side residents, at the 2% significance level. H0:μw=μeHa:μw≠μe t0=2.364 t0.01=±2.099 Select the correct answer below: No; the test statistic is not between the critical values. No; the test statistic is between the critical values. Yes; the test statistic is not between the critical values. Yes; the test statistic is between the critical values.arrow_forward
- 1. Suppose we are interested in the relationship between individuals’ place of residence (rural versus urban) and their political affiliation (Republican versus Democrat). A random sample of 100 individuals yields the following crosstabulation: Political Affiliation Place of Residence Republican Democrat Rural 21 29 Urban 14 36 A. In words, what is the null hypothesis to be tested? B. Is the relationship between place of residence and political affiliation statistically significant at the .05 level? (Be sure to show the statistics that lead to your decision.) C. Compute and interpret an appropriate measure of association for the relationship between these two variables. D. Using the typical rules of thumb, would you say…arrow_forwardBack in April and May of 1985, the Gallup organization conducted a poll to estimate the percentage of Americans who approved of how President Reagan was handling his job. At the 5% significance level, do the data suggest that the percentage of those who approved of Reagan increased from April to May in 1985? Population 1: April p = 795/1528 = 0.5203 Population 2: May p = 840/1528 = 0.5497 Show all your steps, setting up your null and alternative hypothesis.arrow_forwardIf the p-value of a hypothesis test is equal to 0.035, then the null hypothesis will be rejected for which cases? SELECT ALL THAT APPLY. a. for a significance level of 0.01 b. for a significance level of 0.10 c. for a significance level of 0.05 d. for a significance level of 0.02arrow_forward
- Watch Corporation of Switzerland claims that its watches on average will neither gain nor lose time during a week. A sample of 18 watches provided the following gains (+) or losses (−) in seconds per week. −0.44 −0.24 −0.32 −0.30 +0.41 −0.28 +0.48 +0.24 −0.13 −0.28 −0.62 −0.45 −0.49 −0.57 −0.07 −0.20 −0.53 +0.06 State the null hypothesis and the alternate hypothesis. State the decision rule for 0.01 significance level. (Negative amounts should be indicated by a minus sign. Round your answers to 3 decimal places.) Compute the value of the test statistic. (Negative amount should be indicated by a minus sign. Round your answer to 3 decimal places.) Is it reasonable to conclude that the mean gain or loss in time for the watches is 0? Use the 0.01 significance level. Estimate the p-value.arrow_forwardGiven the information for experiment 1, what is the null hypothesis, standard error, z-critical, and z-observed?arrow_forwardFor the given value of α and observed significance level (p -value), indicate whether the null hypothesis would be rejected.α = 0.01, p- value = 0.09 Reject H0 Fail to reject H0arrow_forward
 Glencoe Algebra 1, Student Edition, 9780079039897...AlgebraISBN:9780079039897Author:CarterPublisher:McGraw Hill