
The effect of changes in price of oil along with subsidy on the price of corn, wheat, and farmland.
Explanation of Solution
The effect of changes in price of oil along with subsidy on the price of corn is depicted in Figure 1 using the demand and supply model.
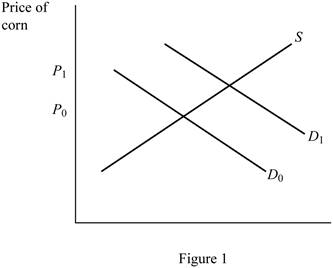
In Figure 1, the horizontal axis represents the quantity of corn, whereas the vertical axis denotes the price of corn.
The effect of changes in price of oil along with subsidy on the price of farmland is depicted in Figure 2 using the demand and supply model.
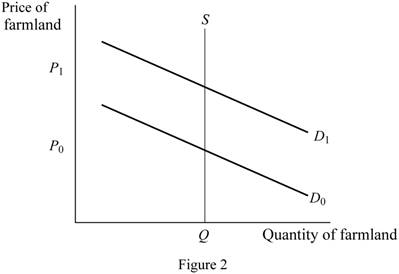
In Figure 2, the horizontal axis represents the quantity of farmland, whereas the vertical axis denotes the price of farmland.
The effect of changes in price of oil along with subsidy on the price of other agricultural products such as wheat is depicted in Figure 3 using the demand and supply model.
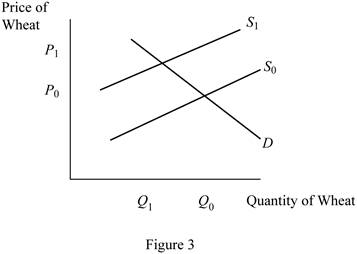
In Figure 3, the horizontal axis represents the quantity of wheat, whereas the vertical axis denotes the price of wheat.
When the oil prices increase simultaneously with the rolling out of subsidy in ethanol production, the demand for ethanol will increase. As the demand for ethanol increases, the demand for corn used for its production also increases. This shifts the demand curve of corn to the right from D0 to D1 as in Figure 1. This increases the price of the corn.
As a result of it, the market value of farmland will increase due to the increase in demand for land as depicted in Figure 2 causing the rightward shift of the demand for land from D0 to D1 as in figure 2.
From now, more of the farmland would be devoted to the production of corn; less of it would be available for the production of other agricultural products such as wheat. This implies that the supply of wheat would decrease causing a leftward shift of the supply curve from S0 to S1 as in Figure 3, thereby increasing the price of wheat.
When the oil prices decreases, the demand for ethanol will decrease. As the demand for ethanol decreases, the demand for corn used for its production also decreases. This shifts the demand curve of corn to the left from D1 to D0 as in Figure 1. This decreases the price of the corn.
As a result of it, the market value of farmland will decrease due to the decrease in demand for land for corn production as depicted in Figure 2 causing the leftward shift of the demand for land from D1 to D0 as in Figure 2. This decreases the price of the farmland.
From now, less of the farmland would be devoted to the production of corn; more of it would be available for the production of other agricultural products such as wheat. This implies that the supply of wheat would increase causing a rightward shift of the supply curve from S1 to S0 as in figure 3, thereby decreasing the price of wheat.
Demand: Demand is the quantity of goods and services that people are willing and able to buy at different prices in a given period of time.
Supply: Supply is the quantity of goods and services that people are willing to sell at different prices in a given period of time.
Want to see more full solutions like this?
Chapter 12 Solutions
Principles Of Microeconomics (book With Myeconlab With Pearson Etext Access Card)

- Billionaire real estate mogul Glenn Rhee owns two large parcels of land in Alexandria, VA: Greenacre and Blueacre. Greenacre is to the north and Blueacre is directly south. Both parcels of land are surrounded by protected conservation land. A state highway runs perpendicular to the properties. Highway __ __ __ __ __ __ __ __ __ __ __ __ __ ______________________________________________________________________ Six years ago, Mr. Rhee decided to leave the real estate business and open a chain of pizza restaurants called “Maggie’s Slice.” Greenacre was quickly purchased by Walker Treatment Inc., which is a hazardous materials treatment center. For the past six years Walker Treatment Inc. has crossed over Blueacre in order to reach the highway that runs perpendicular to the land. Greenacre does not have its own access to the highway. Walker Treatment Inc. uses the highway to pick up hazardous waste from all over the county and processes it at its treatment center. Occasionally, customers…arrow_forwardFor each of the following scenarios, identify the number of firms present, the type of product, and the appropriate market model. Select the matching entry for each dropdown box in the following table. Scenario Number of Firms Type of Product Market Model A large city has lots of small shops where people can buy sweaters. Each store's sweaters reflect the style of that particular store. Additionally, some stores use higher-quality yarn than others, which is reflected in their price. There are dozens of pasta producers that sell pasta to hundreds of Italian restaurants nationwide. The restaurant owners buy from the cheapest pasta producer they can. While pasta manufacturers must pay licensing fees to their local government and undergo regular food-safety inspections, anyone who has passed inspections can acquire and maintain their license. Only three airlines fly from San Francisco to Medford, Oregon. No new airline will enter…arrow_forwardIn the results, Sam's earnings are listed first and Jane's earnings are listed second. Jane A B Sam A ($100, $100) ($200, $0) B ($0, $200) ($150, $150) Jane and Sam are the only two growers who provide organically grown tomatoes to a local supermarket. They know that if they cooperated and produced less tomatoes, they could raise the price of tomatoes. If they work independently, they will earn $100 each. If they decide to work together and both lower their output, the will earn $150 each. If one person lowers output and the other does not, the person who lowers output will earn $0 and the other person will capture the entire market and will earn $200. The table above represents the choices available to Jane and Sam. What is the best choice for Sam if he is sure that Jane will cooperate? If Jane thinks Sam will cheat, what should she do and why? What is the prisoner's dilemma result? What is the preferred choice if they could ensure cooperation? A = Work…arrow_forward
- The prairie dog has always been considered a problem for Canadian cattle ranchers. They dig holes that cattle and horses can step in, and they eat grass necessary for cattle. Recently, ranchers have discovered that there is a demand for prairie dogs as pets. In some areas, prairie dogs can sell for as high as $150. Cattlemen are now fencing off prairie dog towns on their land so these towns will not be disturbed by their cattle. Draw a production possibilities frontier demonstrating a rancher’s production option between cattle production and prairie dog production, showing increasing opportunity cost and what would happen in each of the following situations (using a separate graph for each situation): a. The outcome is efficient, with ranchers choosing to produce equal numbers of cattle and prairie dogs. b. As a protest against the government introducing the grey wolf back into the wild in their province, ranchers decide not to use 25% of the available grassland for grazing. c. The…arrow_forwardTheo sells baby rattles at $3 per unit and each month he sells 3,000 units out of the back of his wagon in the city park. Theo has no employees and estimates he could rent his wagon to another entrepreneur for $2,000 eachmonth. He also knows that he could earn about $5,000 a month as a model. He pays $1 per unit for plastic, his only raw material. Question: Should Theo continue to sell his baby rattles in the park? Explainarrow_forwardSuppose Madison operates a handicraft pop-up retail shop that sells rompers. Assume a perfectly competitive market structure for rompers with a market price equal to $20 per romper. The following graph shows Madison's total cost curve. (Image down below) 3. Profit maximization using total cost and total revenue curves Suppose Madison operates a handicraft pop-up retail shop that sells rompers. Assume a perfectly competitive market structure for rompers with a market price equal to $20 per romper. The following graph shows Madison's total cost curve. (image work) (image work) Madison's profit is maximized when they produce a total of _____ rompers. At this quantity, the marginal cost of the final romper they produce is $___, an amount (greater/less) than the price received for each romper they sell. At this point, the marginal cost of producing one more romper (the first romper beyond the profit-maximizing quantity) is $____, an amount (greater/less) than the price…arrow_forward
- What is one industry, firm, or product that has disappeared from the market as a result of allocative efficiency and creative destruction and replaced by another industry, firm, or product? And what are some pros and cons?arrow_forwardA new French law is forcing industry giants to donate or recycle unsold goods that they would have otherwise destroyed. Apparel companies, from elite fashion houses to mass-market chains, are saddled with an inventory glut following months long closures during the pandemic. Now, they are trying to get rid of the excess without angering waste-conscious consumers—or harming their brands, reports The Wall Street Journal (Aug. 14. 2020). (Links to an external site.) In the U.S., brands and retailers locked out of an entire fashion season are flooding charities with unsold products, in addition to sending goods to discount stores and liquidators. Good360, a nonprofit that collects excess merchandise and distributes it to charities, expects more than $660 million in donations for the entire year, double what it received last year. “Brands don’t want their unsold products winding up at flea markets or on Craigslist,” said the CEO of Good360. LVMH—which owns Louis Vuitton, Dior and other…arrow_forwardDavid and Morgan are farmers. Each one owns an 18-acre plot of land. The following table shows the amount of zucchini and watermelon each farmer can produce per year on a given acre. Each farmer chooses whether to devote all acres to producing zucchini or watermelon or to produce zucchini on some of the land and watermelon on the rest.arrow_forward
- In Southeast Asia, Grab, the Singapore-based ride-hailing company, forced Uber out of the region in 2018 and acquired its local operations. A few months later, it expanded its app to offer its 130 million users not only food delivery and travel booking, but also financial and other services. These efforts helped Grab hit $1 billion in revenue in 2018 and attract more than $3 billion in fresh funding to expand. Later this year, it’ll add healthcare services from Ping An, the Chinese digital health giant. To Uber, Grab is a typical example of _________. * bargaining power of suppliers to the industry threat of substitute products or services rivalry among companies competing in the industry threat of new entrants to the industryarrow_forwardRamon and Sammy are working on a group homework assignment. The homework consists of a set of essay questions and a set of questions on graphing models. Ramon can finish an essay question in about 15 minutes and a graphing question in about 30 minutes. Sammy can finish an essay question in about 20 minutes and a graphing question in about 35 minutes. Assume that Ramon and Sammy produce the same quality answers. Calculate Ramon and Sammy's opportunity cost of each task. Please round each answer to the nearest tenth. a. Ramon’s opportunity cost of completing an essay question: _____graphing questions b. Ramon’s opportunity cost of completing a graphing question: _________essay questions c. Sammy’s opportunity cost of completing an essay question: _________graphing questions d. Sammy’s opportunity cost of completing a graphing question: _________essay questions e. If the two want to specialize in working on…arrow_forwardHow would you explain allocative efficiency in a purely competitive market structure? Group of answer choices Firms produce the quantity where the price consumers pay is less than the cost to society to produce it. Firms produce that quantity where the price consumers pay equals the cost to society to produce it. Allocative efficiency is a concept involving only two goods, so it cannot be applied to a perfectly competitive market.. Firms ensure that they produce enough quantity so that everyone who wishes to buy the product can do so.arrow_forward

 Principles of Economics (12th Edition)EconomicsISBN:9780134078779Author:Karl E. Case, Ray C. Fair, Sharon E. OsterPublisher:PEARSON
 Engineering Economy (17th Edition)EconomicsISBN:9780134870069Author:William G. Sullivan, Elin M. Wicks, C. Patrick KoellingPublisher:PEARSON
 Principles of Economics (MindTap Course List)EconomicsISBN:9781305585126Author:N. Gregory MankiwPublisher:Cengage Learning
 Managerial Economics: A Problem Solving ApproachEconomicsISBN:9781337106665Author:Luke M. Froeb, Brian T. McCann, Michael R. Ward, Mike ShorPublisher:Cengage Learning
 Managerial Economics & Business Strategy (Mcgraw-...EconomicsISBN:9781259290619Author:Michael Baye, Jeff PrincePublisher:McGraw-Hill Education