
Concept explainers
Videos
(a)
To sketch: The graph of the function
(a)
Explanation of Solution
Let x-axis represents the temperature in Celsius and the y-axis represents the temperature in Fahrenheit.
Given that the linear function of Fahrenheit is
Obtain the values of F for various values of C as tabulated in Table 1 and draw the graph of F as shown below in Figure 1.
| C | F |
| -100 | -148 |
| -50 | -58 |
| 0 | 32 |
| 50 | 122 |
Table 1
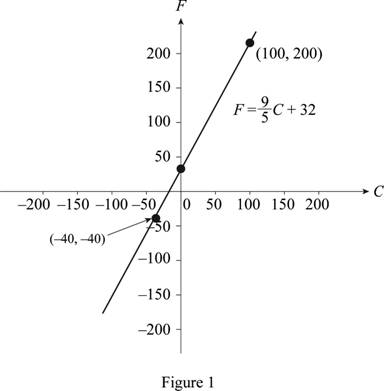
From Figure 1, it is observed that the temperature in C and F are the same in −40.
(b)
To find: The value of the slope and F-intercept; explain the meaning of them.
(b)
Answer to Problem 13E
The value of slope is
The value of F-intercept is 32.
Explanation of Solution
From Figure 1, the value of slope is
Slope denotes the rate of change of F for each
The value of y-intercept is 32. This value represents the corresponding Fahrenheit temperature of
Chapter 1 Solutions
Single Variable Calculus: Concepts and Contexts, Enhanced Edition


 Calculus: Early TranscendentalsCalculusISBN:9781285741550Author:James StewartPublisher:Cengage Learning
 Thomas' Calculus (14th Edition)CalculusISBN:9780134438986Author:Joel R. Hass, Christopher E. Heil, Maurice D. WeirPublisher:PEARSON
 Calculus: Early Transcendentals (3rd Edition)CalculusISBN:9780134763644Author:William L. Briggs, Lyle Cochran, Bernard Gillett, Eric SchulzPublisher:PEARSON
 Calculus: Early TranscendentalsCalculusISBN:9781319050740Author:Jon Rogawski, Colin Adams, Robert FranzosaPublisher:W. H. Freeman
 Calculus: Early Transcendental FunctionsCalculusISBN:9781337552516Author:Ron Larson, Bruce H. EdwardsPublisher:Cengage Learning