
Videos
To check: Whether there is sufficient evidence to conclude a difference in mean prices.
To perform: The appropriate test to find out where the difference exists if the there is a difference in mean prices.
Answer to Problem 14CQ
Yes, there is sufficient evidence to conclude a difference in means.
There is a significant difference between the means
Explanation of Solution
Given info:
The table shows the prices of four different bottles of nationwide brands. The level of significance is 0.05.
Calculation:
The hypotheses are given below:
Null hypothesis:
Alternative hypothesis:
Here, at least one mean is different from the others is tested. Hence, the claim is that, at least one mean is different from the others.
The level of significance is 0.05. The number of samples k is 3, the sample sizes
The degrees of freedom are
Where
Substitute 3 for k in
Substitute 12 for N and 3 for k in
Critical value:
The critical F-value is obtained using the Table H: The F-Distribution with the level of significance
Procedure:
- Locate 9 in the degrees of freedom, denominator row of the Table H.
- Obtain the value in the corresponding degrees of freedom, numerator column below 2.
That is, the critical value is 4.26.
Rejection region:
The null hypothesis would be rejected if
Software procedure:
Step-by-step procedure to obtain thetest statistic using the MINITAB software:
- Choose Stat > ANOVA > One-Way.
- In Response, enter the Prices.
- In Factor, enter the Factor.
- Click OK.
Output using the MINITAB software is given below:
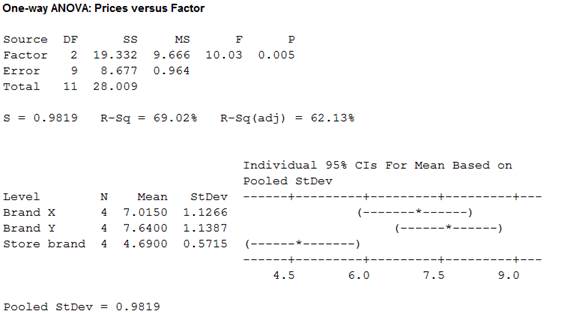
From the MINITAB output, the test value F is 10.03.
Conclusion:
From the results, the test value is 10.03.
Here, the F-statistic value is greater than the critical value.
That is,
Thus, it can be concluding that, the null hypothesis is rejected.
Hence, the result concludes that, there is sufficient evidence to conclude a difference in means.
Consider,
Step-by-step procedure to obtain the test mean and standard deviation using the MINITAB software:
- Choose Stat > Basic Statistics > Display
Descriptive Statistics . - In Variables enter the columns Brand X, Brand Y and Store brand.
- Choose option statistics, and select Mean, Variance and N total.
- Click OK.
Output using the MINITAB software is given below:
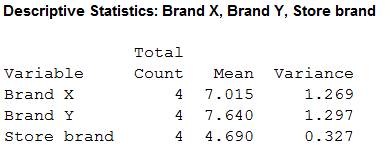
The sample sizes
The means are
The sample variances are
Here, the samples of sizes of three states are equal. So, the test used here is Tukey test.
Tukey test:
Critical value:
Here, k is 3 and degrees of freedom
Substitute 12 for N and 3 for k in v
The critical F-value is obtained using the Table N: Critical Values for the Tukey test with the level of significance
Procedure:
- Locate 9 in the column of v of the Table H.
- Obtain the value in the corresponding row below 3.
That is, the critical value is 3.95.
Comparison of the means:
The formula for finding
That is,
Comparison between the means
The hypotheses are given below:
Null hypothesis:
Alternative hypothesis:
Rejection region:
The null hypothesis would be rejected if absolute value greater than the critical value.
Absolute value:
The formula for comparing the means
Substitute 7.015 and 7.640 for
Thus, the value of
Hence, the absolute value of
Conclusion:
The absolute value is 1.27.
Here, the absolute value is lesser than the critical value.
That is,
Thus, the null hypothesis is not rejected.
Hence, there is significant difference between the means
Comparison between the means
The hypotheses are given below:
Null hypothesis:
Alternative hypothesis:
Rejection region:
The null hypothesis would be rejected if absolute value greater than the critical value.
Absolute value:
The formula for comparing the means
Substitute 7.015 and 4.690 for
Thus, the value of
Hence, the absolute value of
Conclusion:
The absolute value is 4.74.
Here, the absolute value is greater than the critical value.
That is,
Thus, the null hypothesis is rejected.
Hence, there is significant difference between the means
Comparison between the means
The hypotheses are given below:
Null hypothesis:
Alternative hypothesis:
Rejection region:
The null hypothesis would be rejected if absolute value greater than the critical value.
Absolute value:
The formula for comparing the means
Substitute 7.640 and 4.690 for
Thus, the value of
Hence, the absolute value of
Conclusion:
The absolute value is 6.01.
Here, the absolute value is greater than the critical value.
That is,
Thus, the null hypothesis is rejected.
Hence, there is significant difference between the means
Justification:
From the results, it can be observed that there is a significant difference between the means
Want to see more full solutions like this?
Chapter 12 Solutions
ELEMENTARY STATISTICS W/CONNECT >IP<


 Glencoe Algebra 1, Student Edition, 9780079039897...AlgebraISBN:9780079039897Author:CarterPublisher:McGraw Hill