
Videos
Nutrition
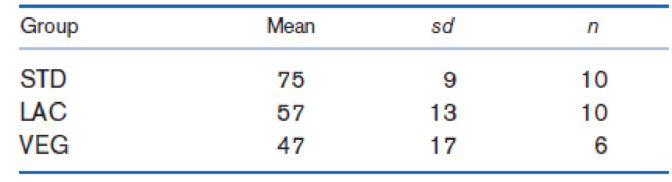
Researchers compared protein intake among three groups of postmenopausal women: (1) women eating a standard American diet (STD), (2) women eating a lacto-ovo-vegetarian diet (LAC), and (3) women eating a strict vegetarian diet (VEG). The mean ± 1 sd for protein intake (mg) is presented in Table 12.29.
Perform a statistical procedure to compare the means of the three groups using the critical-value method.
Table 12.29 Protein intake (mg) among three dietary groups of postmenopausal women
Conduct the test to compare the means of the three groups using critical value method.
Answer to Problem 1P
There is sufficient evidence to conclude that there is a significant difference between the means of the three groups at 5% level of significance.
Explanation of Solution
Hypotheses for the test is given below:
Null hypothesis:
Alternative hypothesis:
There are 3 groups and 26 observations.
That is,
The means sum of squares are as follows:
The sum of squares is calculated as follows:
The test statistic for the test is calculated as given below:
Critical value:
Consider the level of significance as 0.05.
The numerator degrees of freedom is 2 and the denominator degrees of freedom is 23.
Software procedure:
Step-by-step procedure to obtain critical value using Excel software:
- Open Excel sheet.
- Enter the formula, “=F.INV(0.95,2,23)” in cell A1.
- Click Enter.
Output using Excel software is given below:
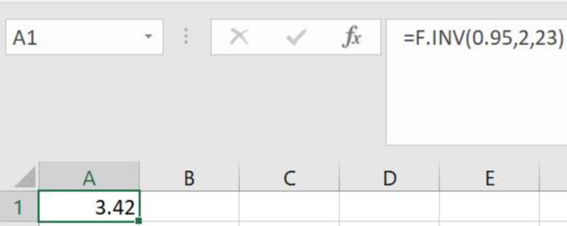
Thus, the F-critical value is 3.42.
Decision based on critical value:
Reject the null hypothesis H0 if, if F> F-critical value;
Otherwise fail to reject H0.
Conclusion:
Here, F(=10.23)> F-critical value (=3.42).
Therefore, the null hypothesis is rejected.
Thus, there is sufficient evidence to conclude that there is a significant difference between the means of the three groups at 5% level of significance.
Want to see more full solutions like this?
Chapter 12 Solutions
Fundamentals of Biostatistics


- NutritionResearchers compared protein intake among threegroups of postmenopausal women: (1) women eating astandard American diet (STD), (2) women eating a lactoovo-vegetarian diet (LAC), and (3) women eating a strictvegetarian diet (VEG). The mean ± 1 sd for protein intake(mg) is presented in Table 12.29.*12.1 Perform a statistical procedure to comparethe means of the three groups using the critical-valuemethod.arrow_forwardResearchers compared protein intake among three groups of postmenopausal women: (1) women eating a standard American diet (STD), (2) women eating a lactoovo- vegetarian diet (LAC), and (3) women eating a strict vegetarian diet (VEG). The mean ± 1 sd for protein intake (mg) is presented in Table 12.29. 12.4 Suppose that in the general population, 70% of vegetarians are lacto-ovo-vegetarians, whereas 30% are strict vegetarians. Perform a statistical procedure to test whether the contrast L = 0.7y2 + 0.3y3 − y1 is significantly different from 0. What does the contrast mean?12.5 Using the data in Table 12.29, perform a multiplecomparisons procedure to identify which specific underlying means are different.arrow_forwardResearchers compared protein intake among three groups of postmenopausal women: (1) women eating a standard American diet (STD), (2) women eating a lactoovo-vegetarian diet (LAC), and (3) women eating a strict vegetarian diet (VEG). The mean ± 1 sd for protein intake (mg) is presented in Table 12.29. *12.4 Suppose that in the general population, 70% of vegetarians are lacto-ovo-vegetarians, whereas 30% are strict vegetarians. Perform a statistical procedure to test whether the contrast L y = + 07 03 2 3y y − 1 . . is significantly different from 0. What does the contrast mean? 12.5 Using the data in Table 12.29, perform a multiple comparisons procedure to identify which specific underlying means are different.arrow_forward
- NutritionResearchers compared protein intake among threegroups of postmenopausal women: (1) women eating astandard American diet (STD), (2) women eating a lactoovo-vegetarian diet (LAC), and (3) women eating a strictvegetarian diet (VEG). The mean ± 1 sd for protein intake(mg) is presented in Table 12.29. *12.1 Perform a statistical procedure to comparethe means of the three groups using the critical-valuemethod.*12.2 What is the p-value from the test performed inProblem 12.1? I just want 12.2 solved.arrow_forwardTwo samples of sizes 25 and 20 are independently drawn from two normal populations, where the unknown population variances are assumed to be equal. The number of degrees of freedom of the equal-variances t-test statistic is ?arrow_forwardIn building an arena, steel bars with mean ultimate tensile strength of 400 megapascal(Mpa) with a variance of 81 Mpa were delivered by the manufacturer. The project engineer tested 50 steel bars and found out that the mean ultimate tensile strength is 390 MPa. The decision for the extension of the contract with the manufacturer depends on the engineer. Test the hypotheses whether or not there is no significant difference between the two means using a two-tailed test with a=0.01. 1. What are the appropriate hypotheses for the two-tailed test? 2. What is the test statistics to be used and the reasons for its selection? 3. What is the critical value of c? 4. What is the value of the test statistic or the computed value? 5. Formulate a conclusion about the given situation.arrow_forward
- Five samples of a ferrous-type substance were used to determine if there is a difference between a laboratory chemical analysis and an X-ray fluorescence analysis of the iron content. Each sample was split into two subsamples and the two types of analysis were applied, with the accompanying results. Assuming that the populations are normal, test at the 0.05 level of significance whether the two methods of analysis give, on the average, the same result. Determine the test statistic t=?arrow_forwardIn one study of smokers who tried to quit smoking with nicotine path therapy, 41 were smoking one year after the treatment, and 32 were not smoking one year after the treatment. Use a 0.10 significance level to test the claim that among smokers who try to quit with nicotine patch therapy, the majority are smoking a year after the treatment. a. Define the parameter A. mu = The mean number of smokers who used the patch and were smoking a year after the treatment B. p = The proportion of all smokers who used the patch and were smoking a year after the treatment C. p = The proportion of all smokers who used the patch and were not smoking a year after the treatment D. mu = The proportion of all smokers who used the patch and were smoking a year after the treatment b. State the null and alternative hypotheses A. Upper H 0 : p equals 0.50 Upper H 1 : p greater than 0.50 B. Upper H 0 : p…arrow_forward
 MATLAB: An Introduction with ApplicationsStatisticsISBN:9781119256830Author:Amos GilatPublisher:John Wiley & Sons Inc
 Probability and Statistics for Engineering and th...StatisticsISBN:9781305251809Author:Jay L. DevorePublisher:Cengage Learning
 Statistics for The Behavioral Sciences (MindTap C...StatisticsISBN:9781305504912Author:Frederick J Gravetter, Larry B. WallnauPublisher:Cengage Learning
 Elementary Statistics: Picturing the World (7th E...StatisticsISBN:9780134683416Author:Ron Larson, Betsy FarberPublisher:PEARSON
 The Basic Practice of StatisticsStatisticsISBN:9781319042578Author:David S. Moore, William I. Notz, Michael A. FlignerPublisher:W. H. Freeman
 Introduction to the Practice of StatisticsStatisticsISBN:9781319013387Author:David S. Moore, George P. McCabe, Bruce A. CraigPublisher:W. H. Freeman