Concept explainers
Videos
Read bar graphs, line graphs, and circle graphs.
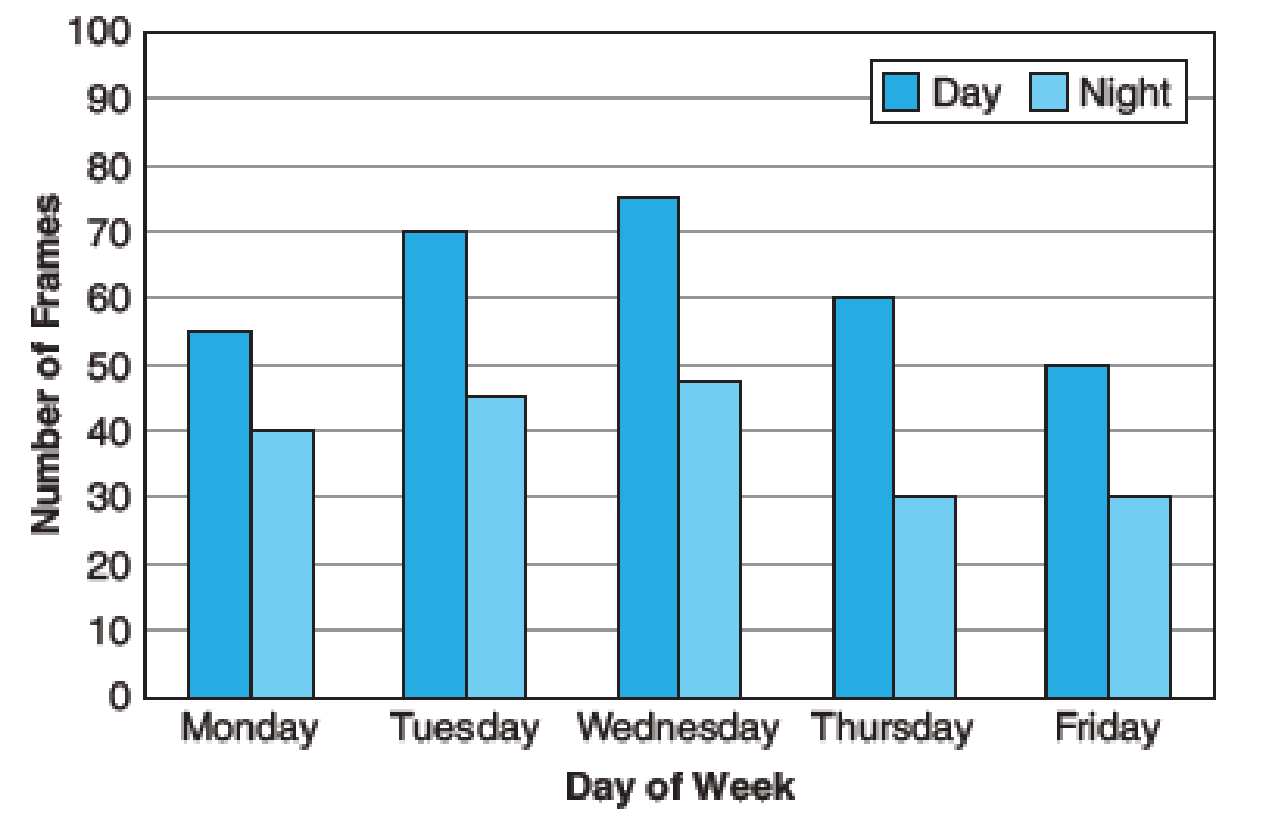
Trades Management From the bar graph below,
- (a) Determine the number of frames assembled by the Tuesday day shift. __________
- (b) Calculate the percent decrease in output from the Monday day shift to the Monday night shift. __________
Weekly Frame Assembly
Monthly Paint Jobs at Autobrite
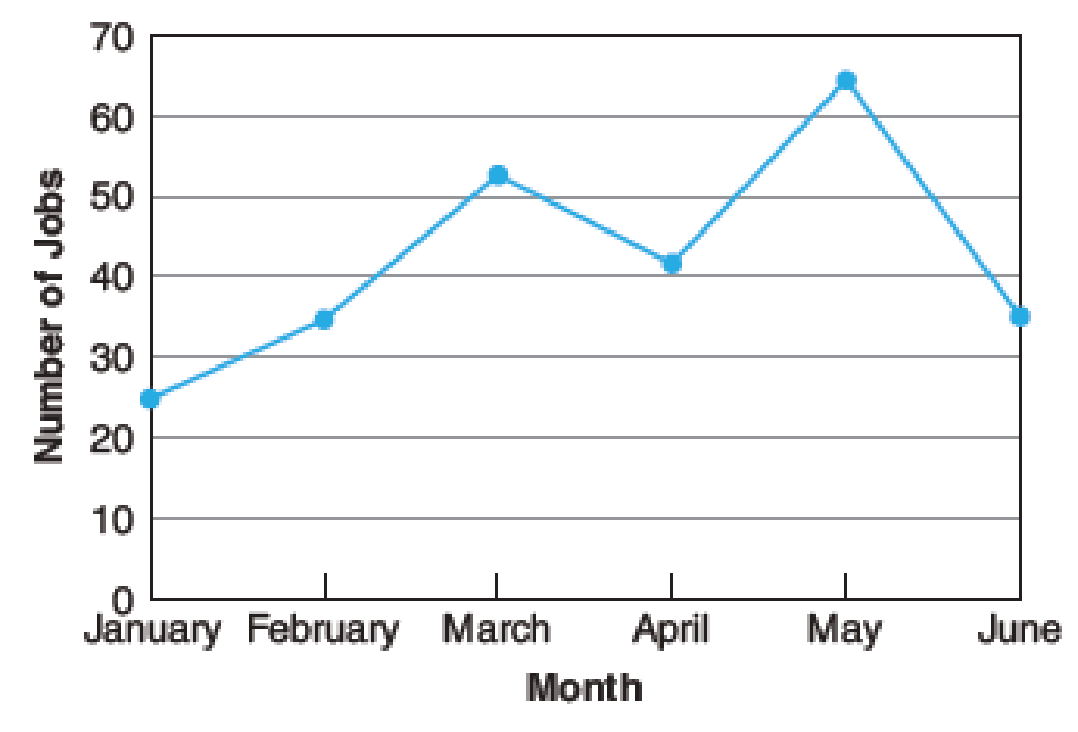
Problems (c) and (d) refer to the line graph above.
- (c) Determine the maximum number of paint jobs and the month during which they occurred. _________
- (d) Calculate the percent increase in the number of paint jobs from January to February. _________
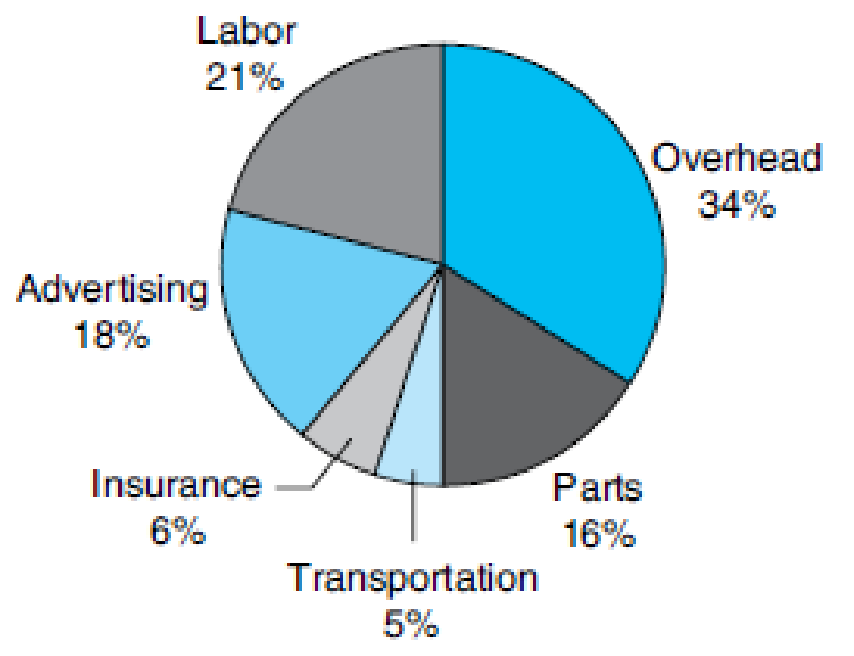
- (e) The average job for ABC Plumbing generates $227.50. Use the circle graph on the next page to calculate what portion of this amount is spent on advertising. _________
Percent of Business Expenditures
(a)
The number of frames assembled by the Tuesday day shift
Answer to Problem 1P
The number of frames assembled by the Tuesday day shift is
Explanation of Solution
Given:
The bar graph for the weekly frame assembly that is the number of frames in the day shift and night shift is mentioned.
Calculation:
From the bar graph, the height of the bar corresponding to the day of Tuesday for the day shift is 70. That is, there are 70 frames in the day shift.
Thus, the number of frames assembled by the Tuesday day shift is
(b)
The percent decrease in output from the Monday day shift to the Monday night shift
Answer to Problem 1P
The percent decrease in output from the Monday day shift to the Monday night shift is
Explanation of Solution
Formula used:
Percent change in proportion:
Calculation:
From the bar graph, the height of the bar corresponding to the day of Monday for the day shift is 55. That is, there are 55 frames in the day shift. The day of Monday for the night shift is 40. That is, there are 40 frames in the day shift.
The difference in frames is,
Substitute 55 as base and 15 as amount of decrease in the percent formula.
Thus, the percent decrease in output from the Monday day shift to the Monday night shift is
(c)
The maximum number of paint jobs and the month during which they occurred
Answer to Problem 1P
The maximum number of paint jobs is
The month during which maximum number of paint jobs occurred is
Explanation of Solution
Given:
The line graph of Monthly Paint Jobs at Autobrite is mentioned.
Calculation:
From the line graph it can be observed that the highest point of the paint jobs is 65 which correspond to the month of May. That is, the month of May has the highest jobs of 65.
Thus, the maximum number of paint jobs is
(d)
The percent increase in the number of paint jobs from January to February
Answer to Problem 1P
The percent increase in the number of paint jobs from January to February is
Explanation of Solution
From the line graph, the number of jobs corresponding to the month of January is 25 and the number of jobs corresponding to the month of February is 35.
The difference in jobs is,
Substitute 25 as base and 10 as amount of increase in the percent formula.
Thus, the percent increase in the number of paint jobs from January to February is
(e)
The portion of amount $227.50 that is spent on advertising based on the circle graph
Answer to Problem 1P
The portion of amount $227.50 that is spent on advertising based on the circle graph is
Explanation of Solution
Given:
The circle graph of Percent of Business Expenditures is mentioned. Also, average job for ABC Plumbing generates $227.50.
Calculation:
From the circle graph, the percentage of the business expenditure spent on advertising is 18%.
The amount is,
Thus, the portion of amount $227.50 that is spent on advertising based on the circle graph is
Want to see more full solutions like this?
Chapter 12 Solutions
Mathematics for the Trades: A Guided Approach (11th Edition) (What's New in Trade Math)


- Using your graphing calculator, make a scatter plot of the data from the table. Then graph your model from Question 2 along with the data. How well does your model fit the data? What could you do to try to improve your model?arrow_forwardLife Expectancy Versus Health Care Spending One article shows a relationship between per capita health care spending h, in thousands of U.S. dollars per person per year, and life expectancy E, in years. The following formula is adapted from that article: E=72.23+3.85h0.37h2 We should point out that this article includes no justification for the type of model used. a.Plot the graph E versus h. Include spending levels from 1000 to 9000 per person per year so a horizontal span of 1 to 9. b. According to this model, what health care expenditure corresponds to maximum longevity? Round your answer in thousands of dollars per person per year to two decimal places. c.What optimum life expectancy is given by this model? For comparison, in 2011, in the United States, per capita health care spending was 8745 and life expectancy was 78.7 years.arrow_forward
 Glencoe Algebra 1, Student Edition, 9780079039897...AlgebraISBN:9780079039897Author:CarterPublisher:McGraw Hill
 Algebra and Trigonometry (MindTap Course List)AlgebraISBN:9781305071742Author:James Stewart, Lothar Redlin, Saleem WatsonPublisher:Cengage Learning
 Mathematics For Machine TechnologyAdvanced MathISBN:9781337798310Author:Peterson, John.Publisher:Cengage Learning,
 Functions and Change: A Modeling Approach to Coll...AlgebraISBN:9781337111348Author:Bruce Crauder, Benny Evans, Alan NoellPublisher:Cengage Learning
 Algebra: Structure And Method, Book 1AlgebraISBN:9780395977224Author:Richard G. Brown, Mary P. Dolciani, Robert H. Sorgenfrey, William L. ColePublisher:McDougal Littell