
Videos
For the preceding problem you should find that there are significant differences among the three treatments. One reason for the significance is that the sample variances are relatively small. To create the following data, we kept the same sample means that appeared in problem 19 but doubled the SS values within each sample.
- a. Calculate the sample variance for each of the three samples. Describe how these sample variances compare with those from problem 19.
- b. Predict how the increase in sample variance should influence the outcome of the analysis. That is, how will the F-ratio for these data compare with the value obtained m problem 19?
- c. Use an A VOVA with α – .05 to determine whether there are any significant differences among the three treatment means. (Does your answer agree with your prediction in purl b?)
a.
To compare: Obtained sample variances with sample variances from problem 19.
Answer to Problem 20P
Sample variances for treatment 1, treatment 2, and treatment 3 are 24, 26 and 16 respectively. Obtained sample variance for each treatment are twice of the sample variance in problem 19.
Explanation of Solution
Given info:
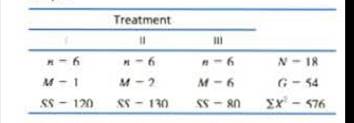
The following values are from an independent-measures study comparing three treatment conditions.
| Treatment | |||
| I | II | III | |
|
|
|
|
|
|
|
|
|
|
|
|
|
|
|
Calculation:
Let k represents the numbers of treatments. Then,
For treatment 1
Let
For treatment 2
Let
For treatment 3
Let
The sample variances for treatment I, treatment II and treatment III in problem 19 are 12, 13 and 8 respectively. But sample variances for all treatments in this problem are twice of sample variances in problem 19.
Conclusion:
Sample variances for treatment 1, treatment 2, and treatment 3 are 24, 26 and 16 respectively. Obtained sample variance for each treatment are twice of the sample variance in problem 19.
b.
To predict: The outcome of the analysis.
Answer to Problem 20P
The size of the F-ratio decreases and there are fewer chances to reject the null hypothesis.
Explanation of Solution
From part a. sample variance for each treatment are twice of the sample variances in problem 19.
The formula for F ratio is:
F-ratio is inversely proportional to the mean sum of squares within treatments. So, large sample variances give large mean sum of squares within treatments and hence small value of F-ratio. Therefore, on increasing the size of sample variances, the size of F-ratio would decreases. So, when sample variances increases, chances to reject the null hypothesis decreases.
Conclusion:
The size of the F-ratio decreases and there are fewer chances to reject the null hypothesis.
c.
Answer to Problem 20P
There are no significant mean differences between the three treatments.
Explanation of Solution
Calculation:
Let k represents the numbers of treatments. Then,
Then, degrees of freedom corresponding to
Then, degrees of freedom corresponding to
Total sum of squares is given as:
Sum of squares between treatments is given as:
F-ratio is calculated as:
From the table
Since, F-ratio is less than the critical value; therefore, we fail to reject the null hypothesis and conclude that there are no significant mean differences between the treatments.
Conclusion:
There are no significant mean differences between the treatments. Also, the answer agree with prediction in part b.
Want to see more full solutions like this?
Chapter 12 Solutions
Essentials of Statistics for The Behavioral Sciences (MindTap Course List)


 MATLAB: An Introduction with ApplicationsStatisticsISBN:9781119256830Author:Amos GilatPublisher:John Wiley & Sons Inc
 Probability and Statistics for Engineering and th...StatisticsISBN:9781305251809Author:Jay L. DevorePublisher:Cengage Learning
 Statistics for The Behavioral Sciences (MindTap C...StatisticsISBN:9781305504912Author:Frederick J Gravetter, Larry B. WallnauPublisher:Cengage Learning
 Elementary Statistics: Picturing the World (7th E...StatisticsISBN:9780134683416Author:Ron Larson, Betsy FarberPublisher:PEARSON
 The Basic Practice of StatisticsStatisticsISBN:9781319042578Author:David S. Moore, William I. Notz, Michael A. FlignerPublisher:W. H. Freeman
 Introduction to the Practice of StatisticsStatisticsISBN:9781319013387Author:David S. Moore, George P. McCabe, Bruce A. CraigPublisher:W. H. Freeman