
Concept explainers
Videos
In 2011, the industries with the most complaints to the Better Business Bureau were banks, cable and satellite television companies, collection agencies, cellular phone providers, and new car dealerships (USA Today, April 16, 2012). The results for a sample of 200 complaints are contained in the DATAfile named BBB.
- a. Construct a frequency distribution for the number of complaints by industry.
- b. Using α = .01, conduct a hypothesis test to determine whether the
probability of a complaint is the same for the five industries. What is your conclusion? - c. Drop the industry with the most complaints. Using α = .05, conduct a hypothesis test to determine whether the probability of a complaint is the same for the remaining four industries.
a.
Construct a frequency distribution for the number of complaints by industry.
Answer to Problem 25SE
The frequency distribution for the number of complaints by industry is tabulated as follows:
| Category | Observed Frequency |
| Bank | 26 |
| Cable | 44 |
| Car | 42 |
| Cell | 60 |
| Collection | 28 |
Explanation of Solution
Calculation:
The given data show the results for a sample of 200 complaints.
From the given data, it can be observed that the number of categories is 4. The frequencies for bank, cable, car, cell, and collection are 26, 44, 42, 60, and 28, respectively.
Therefore, the frequency distribution for the number of complaints by industry is tabulated as follows:
| Category | Observed Frequency |
| Bank | 26 |
| Cable | 44 |
| Car | 42 |
| Cell | 60 |
| Collection | 28 |
b.
Perform a hypothesis test at 0.01 level of significance.
Draw conclusion.
Answer to Problem 25SE
The conclusion is that the probability of a complaint is not the same for the five industries.
Explanation of Solution
Calculation:
State the test hypotheses:
Null hypothesis:
That is, all population proportions are equal for five museums.
Alternative hypothesis:
That is, not all population proportions are equal for five industries.
The formula for chi-square test statistic is as follows:
Here,
In this case, it is observed that the probability of a complaint is the same for each of the five industries. That is, 0.2
The expected frequency is obtained as follows:
The value of
| Observed Frequency | Expected Frequency | ||
| 26 | 40 | –14 | 4.9 |
| 44 | 40 | 4 | 0.4 |
| 42 | 40 | 2 | 0.1 |
| 60 | 40 | 20 | 10 |
| 28 | 40 | –12 | 3.6 |
| Total |
Thus, the value of
Degrees of freedom:
The degrees of freedom is
Thus, the degree of freedom is 4.
Level of significance:
The given level of significance is
p-value:
Software procedure:
Step-by-step software procedure to obtain p-value using EXCEL:
- Open an EXCEL sheet and select cell A1.
- In cell A1, enter the formula =CHISQ.DIST.RT(19,4).
- Press Enter.
The output obtained using EXCEL is given below:
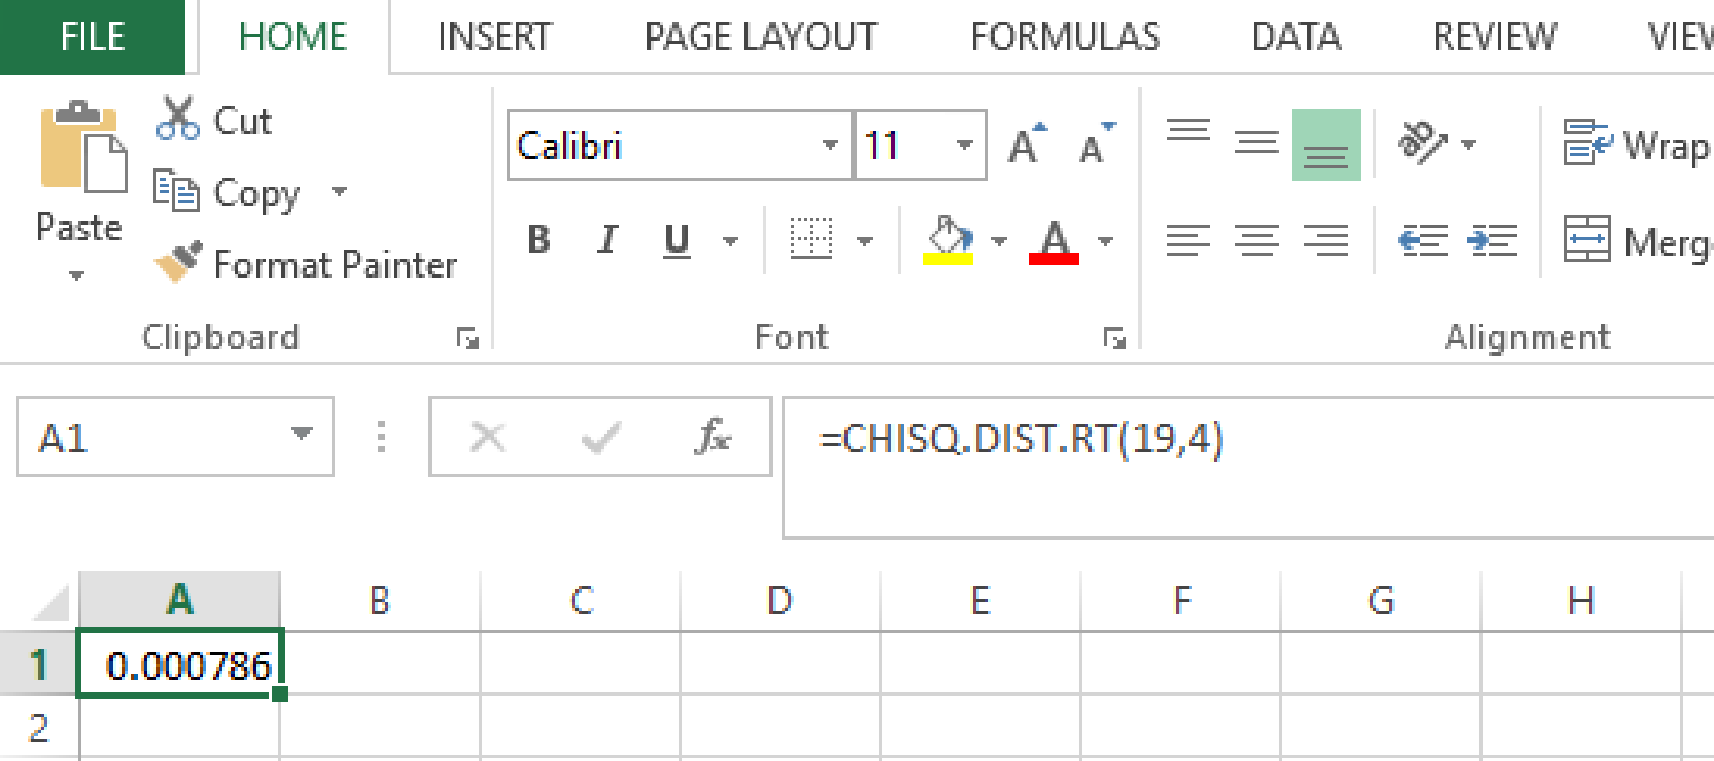
From the output, the p-value is 0.0008.
Rejection rule:
- If the
- Otherwise, do not reject the null hypothesis.
Conclusion:
Here, the p-value is less than the level of significance.
That is,
Thus, the decision is “reject the null hypothesis”.
Therefore, there is sufficient evidence to conclude that the probability of a complaint is not the same for the five industries.
c.
Drop the industry with the most complaints and perform a hypothesis test at 0.05 level of significance.
Answer to Problem 25SE
The conclusion is that the probability of a complaint is the same for the remaining four industries.
Explanation of Solution
Calculation:
From Part (a), it can be observed that the category cell has more complaints. Therefore, drop the category cell.
State the test hypotheses:
Null hypothesis:
That is, all population proportions are equal for five museums.
Alternative hypothesis:
That is, not all population proportions are equal for the remaining four industries.
The formula for chi-square test statistic is as follows:
Here,
In this case, it is observed that the probability of a complaint is the same for each of the four industries. That is, 0.25
The expected frequency is obtained as follows:
The value of
| Observed Frequency | Expected Frequency | ||
| 26 | 35 | –9 | 2.31 |
| 44 | 35 | 9 | 2.31 |
| 42 | 35 | 7 | 1.4 |
| 28 | 35 | –7 | 1.4 |
| Total |
Thus, the value of
Degrees of freedom:
The degrees of freedom is
Thus, the degree of freedom is 3.
Level of significance:
The given level of significance is
p-value:
Software procedure:
Step-by-step software procedure to obtain p-value using EXCEL:
- Open an EXCEL sheet and select cell A1.
- In cell A1, enter the formula =CHISQ.DIST.RT(7.42,3).
- Press Enter.
The output using EXCEL is given below:
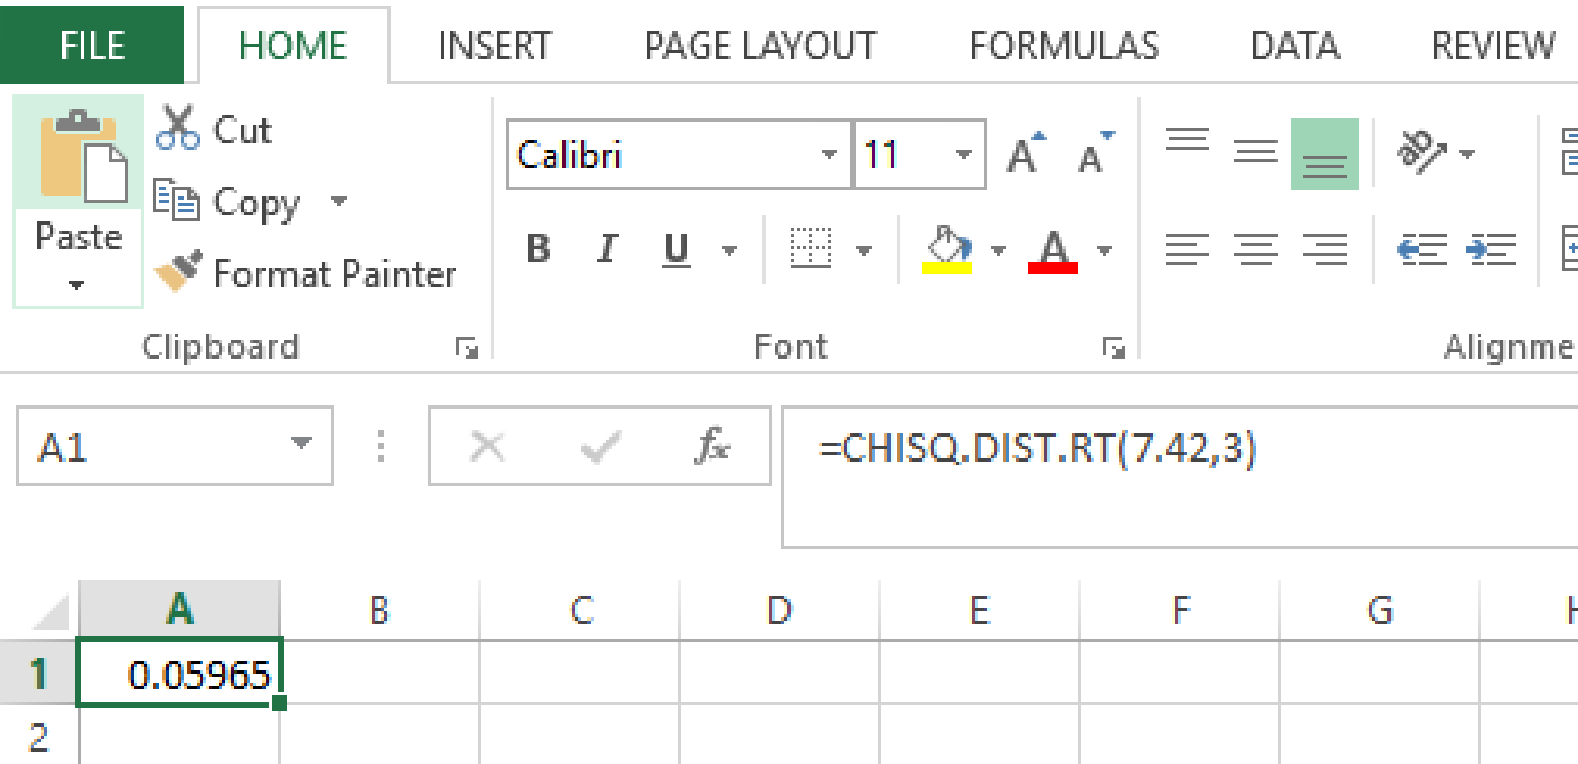
From the output, the p-value is 0.0596.
Rejection rule:
- If the
- Otherwise, do not reject the null hypothesis.
Conclusion:
Here, the p-value is less than the level of significance.
That is,
Thus, the decision is “reject the null hypothesis”.
Therefore, there is no sufficient evidence to conclude that the probability of a complaint is not the same for the remaining four industries.
Therefore, the conclusion is that the probability of a complaint is the same for the remaining four industries.
Want to see more full solutions like this?
Chapter 12 Solutions
Modern Business Statistics with Microsoft Office Excel (with XLSTAT Education Edition Printed Access Card) (MindTap Course List)


 College Algebra (MindTap Course List)AlgebraISBN:9781305652231Author:R. David Gustafson, Jeff HughesPublisher:Cengage Learning