
Cornerstones of Financial Accounting
4th Edition
ISBN: 9781337690881
Author: Jay Rich, Jeff Jones
Publisher: Cengage Learning
expand_more
expand_more
format_list_bulleted
Videos
Textbook Question
Chapter 12, Problem 99.1C
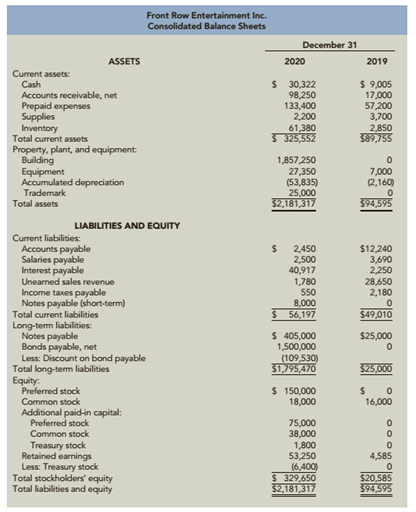
CONTINUING PROBLEM: FRONT ROW ENTERTAINMENT
The income statement and consolidated balance sheets for Front Row Entertainment follow.
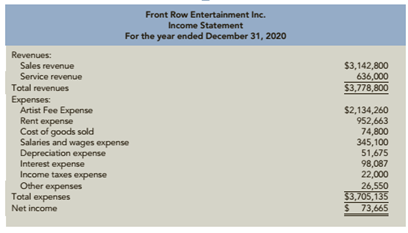
Front Row Entertainment Inc. Income Statement
Required:
Calculate the short-term
Expert Solution & Answer

Trending nowThis is a popular solution!

Students have asked these similar questions
Refer to the following financial statements for Kodenko Inc:
Prepare forecasts of its income statement, statement of financial position and statement of cash flows for 2020 under the following assumptions:a. All financial ratio remains at 2019 level.b. Kodenko will not record restructuring costs for 2020.c. Taxes payable are at the 2019 level of RM544 million.d. Depreciation expense charged to Selling, general and administrative is RM765million for 2019 and 2018 repectively.e. Gross PPE is RM 12,982 million and RM12,963 million for 2019 and 2018 respectively.f. Projected current maturities of long term debt are RM13 million for 2020.g. Capital expenditure for 2019 and 2018 are RM1,047 and RM783, respectively
Ratio Analysis
Based on the Income Statement and Balance Sheet, complete the table below.
Then comment on the liquidity, profitability, leverage, asset management and market value.
Analysis of Financial Data (Table with ratios)
Ratio Analysis
2021
Est.
2020
2019
Industry Average
Liquidity Ratios
Current Ratio (times)
4.2
Quick Ratio (times)
2.1
Asset Management Ratios
Average sales/day
9
Inventory Turnover Ratio (times)
9
Days Sales Outstanding (days)
36
Fixed Assets Turnover Ratio (times)
3
Total Asset Turnover Ratio
1.8
Debt Management Ratios
Total Debt to Total Assets (%)
40
Times Interest Earned (times)
6
Debt to Equity Ratio (%)
1
Profitability Ratios…
Using the financiaql statements of Top Glove Corporation Berhad for the year 2020, provide and comment on the following:
Calculate the profitability, liquidity and effiency ratios of the Top Glove Corporation Berhad company (use the following ratios: gross profit margin, net profit margin, return on capital employed, quick ratio, current ratio, accounts receivable turnover, accounts payables turnover, inventory turnover) for the year 2019 and 2020.
Chapter 12 Solutions
Cornerstones of Financial Accounting
Ch. 12 - Describe how some of the primary groups of users...Ch. 12 - Prob. 2DQCh. 12 - Prob. 3DQCh. 12 - Prob. 4DQCh. 12 - Prob. 5DQCh. 12 - Prob. 6DQCh. 12 - Prob. 7DQCh. 12 - Prob. 8DQCh. 12 - Prob. 9DQCh. 12 - Prob. 10DQ
Ch. 12 - Prob. 11DQCh. 12 - 12. Why are higher asset turnover ratios...Ch. 12 - Prob. 13DQCh. 12 - Prob. 14DQCh. 12 - Prob. 15DQCh. 12 - Prob. 16DQCh. 12 - Which of the following use financial statement...Ch. 12 - Prob. 2MCQCh. 12 - Prob. 3MCQCh. 12 - Prob. 4MCQCh. 12 - Prob. 5MCQCh. 12 - Prob. 6MCQCh. 12 - Prob. 7MCQCh. 12 - Which type of analysis compares a single...Ch. 12 - Which of the following types of analysis compares...Ch. 12 - Which of the following types of analysis is...Ch. 12 - Prob. 11MCQCh. 12 - Prob. 12MCQCh. 12 - Prob. 13MCQCh. 12 - Partial information from Fabray Companys balance...Ch. 12 - Hummel Inc. has $30,000 in current assets and...Ch. 12 - Prob. 16MCQCh. 12 - A firms quick ratio is typically computed as: a....Ch. 12 - Prob. 18MCQCh. 12 - Prob. 19MCQCh. 12 - Prob. 20MCQCh. 12 - Prob. 21MCQCh. 12 - Prob. 22MCQCh. 12 - Prob. 23MCQCh. 12 - When analyzing a companys debt to equity ratio,...Ch. 12 - Prob. 25MCQCh. 12 - Prob. 26MCQCh. 12 - Prob. 27MCQCh. 12 - Prob. 28MCQCh. 12 - Prob. 29MCQCh. 12 - Prob. 30MCQCh. 12 - Which of the following ratios is used to measure...Ch. 12 - Prob. 32MCQCh. 12 - Selected information for Berry Company is as...Ch. 12 - Which of the following ratios is used to measure a...Ch. 12 - Prob. 35MCQCh. 12 - Prob. 36MCQCh. 12 - Prob. 37MCQCh. 12 - Prob. 38MCQCh. 12 - Which of the following are not part of common...Ch. 12 - Prob. 40MCQCh. 12 - Prob. 41MCQCh. 12 - Prob. 42MCQCh. 12 - Which of the following is not included in the...Ch. 12 - When a Dupont analysis reveals that a company has...Ch. 12 - Prob. 45MCQCh. 12 - Cross Sectional Analysis Cross sectional analysis...Ch. 12 - Prob. 47CECh. 12 - Prob. 48CECh. 12 - Short-Term Liquidity Ratios Three ratios...Ch. 12 - Debt Management Ratios Selected data from the...Ch. 12 - Debt Management and Short-Term Liquidity Ratios...Ch. 12 - Asset Efficiency Ratios Selected financial...Ch. 12 - Profitability Ratios The following data came from...Ch. 12 - Prob. 54CECh. 12 - Prob. 55CECh. 12 - Prob. 56CECh. 12 - Prob. 57BECh. 12 - Prob. 58BECh. 12 - Prob. 59BECh. 12 - Short-Term Liquidity Ratios Larry, Curly, and Moe...Ch. 12 - Debt Management Ratios Glow Corporation provides...Ch. 12 - Debt Management and Short-Term Liquidity Ratios...Ch. 12 - Asset Efficiency Ratios Rumsford Inc.s financial...Ch. 12 - Prob. 64BECh. 12 - Profitability Ratios Tinker Corporation operates...Ch. 12 - Profitability Ratios Katrina Corp. is a publicly...Ch. 12 - Prob. 67BECh. 12 - Prob. 68ECh. 12 - Prob. 69ECh. 12 - Prob. 70ECh. 12 - Prob. 71ECh. 12 - Horizontal Analysis of Income Statements...Ch. 12 - Prob. 73ECh. 12 - Prob. 74ECh. 12 - Prob. 75ECh. 12 - Prob. 76ECh. 12 - Prob. 77ECh. 12 - Prob. 78ECh. 12 - Prob. 79ECh. 12 - Asset Efficiency Ratios Refer to financial...Ch. 12 - Prob. 81ECh. 12 - Prob. 82ECh. 12 - Prob. 83ECh. 12 - Prob. 84PSACh. 12 - Prob. 85PSACh. 12 - Prob. 86PSACh. 12 - A Using Common Size Statements The following...Ch. 12 - Prob. 88PSACh. 12 - Prob. 89PSACh. 12 - Prob. 90PSACh. 12 - A Comparing Financial Ratios Presented below are...Ch. 12 - A Preparation of Ratios Refer to the financial...Ch. 12 - Accounting Alternatives and Financial Analysis...Ch. 12 - Prob. 84PSBCh. 12 - Prob. 85PSBCh. 12 - Prob. 86PSBCh. 12 - Prob. 87PSBCh. 12 - Prob. 88PSBCh. 12 - Prob. 89PSBCh. 12 - Prob. 90PSBCh. 12 - Comparing Financial Ratios Presented below are...Ch. 12 - Prob. 92PSBCh. 12 - Problem 1 2-93B Accounting Alternatives and...Ch. 12 - Prob. 94CCh. 12 - Prob. 95.1CCh. 12 - Prob. 95.2CCh. 12 - Prob. 96.1CCh. 12 - Prob. 96.2CCh. 12 - Prob. 97.1CCh. 12 - Prob. 97.2CCh. 12 - Prob. 97.3CCh. 12 - Prob. 97.4CCh. 12 - Analyzing Growth Consolidated financial statements...Ch. 12 - Analyzing Growth Consolidated financial statements...Ch. 12 - Prob. 98.1CCh. 12 - Prob. 98.2CCh. 12 - Prob. 98.3CCh. 12 - CONTINUING PROBLEM: FRONT ROW ENTERTAINMENT The...Ch. 12 - Prob. 99.2CCh. 12 - Prob. 99.3CCh. 12 - Prob. 99.4CCh. 12 - Prob. 99.5C
Knowledge Booster


Learn more about
Need a deep-dive on the concept behind this application? Look no further. Learn more about this topic, accounting and related others by exploring similar questions and additional content below.Similar questions
- Short-Term Liquidity Ratios Three ratios calculated for Puckerman, Cohen, and Chang companies for 2018 and 2019 follow. Required: Explain which company appears to be the most liquid.arrow_forwardA Preparation of Ratios Refer to the financial statements for Burch Industries in Problem 12-89A and the following data. Required: 1. Prepare all the financial ratios for Burch for 2019 and 2018 (using percentage terms where appropriate and rounding all answers to two decimal places). 2. CONCEPTUAL CONNECTION Explain whether Burchs short-term liquidity is adequate. 3. CONCEPTUAL CONNECTION Discuss whether Burch uses its assets efficiently. 4. CONCEPTUAL CONNECTION Determine whether Burch is profitable. 5. CONCEPTUAL CONNECTION Discuss whether long-term creditors should regard Burch as a high-risk or a low-risk firm. 6. Perform a Dupont analysis (rounding to two decimal places) for 2018 and 2019.arrow_forwardRatio Analysis Consider the following information taken from the stockholders equity section: How do you interpret the companys payout and profitability performance? Required: 1. Calculate the following for 2020. (Note. Round answers to two decimal places.) 2. CONCEPTUAL CONNECTION Assume 2019 ratios were: and the current year industry averages are: How do you interpret the companys payout and profitability performance?arrow_forward
- Debt Management and Short-Term Liquidity Ratios The following items appear on the balance sheet of Figgins Company at the end of 2018 and 2019: Required: Between 2018 and 2019, indicate whether Figgins debt to equity ratio increased or decreased. Also, indicate whether Figgins current ratio increased or decreased. Interpret these ratios.arrow_forwardThe Jimenez Corporation’s forecasted 2020 financial statements follow, along with some industry average ratios. Calculate Jimenez’s 2020 forecasted ratios, compare them with the industry average data, and comment briefly on Jimenez’s projected strengths and weaknesses. Jimenez Corporation: Forecasted Balance Sheet as of December 31, 2020 Jimenez Corporation: Forecasted Income Statement for 2020 Jimenez Corporation: Per Share Data for 2020 Notes: aIndustry average ratios have been stable for the past 4 years. bBased on year-end balance sheet figures. cCalculation is based on a 365-day year.arrow_forwardComparative Analysis: Under Armour, Inc., versus Columbia Sportswear Refer to the 10-K reports of Under Armour, Inc., and Columbia Sportswear that are available for download from the companion website at CengageBrain.com. Required: Compare the values and trends of these ratios when evaluating Under Armours and Columbias short-term liquidity.arrow_forward
- Profitability Ratios Tinker Corporation operates in the highly competitive consulting industry. Tinkers balance sheet indicates the following balances as of December 31, 2019. Required: Calculate Tinkers return on equity if Tinkers 2019 net income is $90,000.arrow_forwardUse information from the balance sheet and income statement to calculate the following financial ratios and the market value added (MVA). (Whenever balance sheet numbers are used to calculate financial ratios, please ensure that you use the average of the 2019 and 2020 numbers in your calculation. To calculate MVA, you can assume that the average book value number for common stock and paid-in-surplus is the amount that the shareholders initially invested in the company.)arrow_forwardCalculation and interpretation of ratios. Data for White Star Limited: Net operating profit after tax is $25 million (2018: $38 million). 1. Use the information above to calculate for 2019 and 2018: a working capital b current ratio c quick ratio d debt-to-equity ratio e return on equity ratio f earnings per share ratio. 2. Identify two warning signals that could have negative implications with respect to the company ’ s ability to generate cash flows to meet its future needs. In each case, explain why the signal you have identified could reflect a cash flow problem. 3. At the annual general meeting of White Star, the managing director, Ms Rose Dawson, made the following statement: ‘ Recently a number of articles in the financial press have questioned the financial position of our company. This criticism is totally unjustified. Net profit was $25 million and total assets have increased by $160 million. These results show that 2019 was a very successful year for White Star. ’ Comment on…arrow_forward
- The image uploaded is the calculation of Cal Bank's Profitability ratios, shorter liquidity ratios, long-term liquidity ratios, and investment ratios for 2020, 2021, 2022. A base year of 2019 was also added. Evaluate the financial performance by comparing the three (3) years' financial performance that is 2020, 2021, and 2022 I have provided in the table with the base year.arrow_forwardThe image uploaded is the calculation of Access Bank's Profitability ratios, shorter liquidity ratios, long-term liquidity ratios, and investment ratios for 2020, 2021, 2022. A base year of 2019 was also added. Evaluate the financial performance by comparing the three (3) years' financial performance that is 2020, 2021, and 2022 I have provided in the table with the base year.arrow_forwardPerform a liquidity and profitability analysis on your company utilizing the ratios listed below. Quick Ratio, Receivable Turnover, Days sales uncollected, inventory turnover, Days inventory on hand, payable turnover, days payable, asset turnover, return on assets, and return on equity. statement of operations 12 Months Ended Jul. 31, 2020 Jul. 31, 2019 Revenues: Revenues $ 1,497,826,000 $ 1,684,392,000 Costs and expenses: Operating expense - personnel, vehicle, plant and other 493,055,000 468,868,000 Operating expense - equipment lease expense 33,017,000 Equipment lease expense, preadoption 33,073,000 Depreciation and amortization expense 80,481,000 78,846,000 General and administrative expense 45,752,000 59,994,000 Non-cash employee stock ownership plan compensation charge 2,871,000 5,693,000 Asset impairments 0 0 Loss on asset sales and disposals 7,924,000 10,968,000 Operating income 148,670,000 113,028,000 Interest expense…arrow_forward
arrow_back_ios
SEE MORE QUESTIONS
arrow_forward_ios
Recommended textbooks for you
 Cornerstones of Financial AccountingAccountingISBN:9781337690881Author:Jay Rich, Jeff JonesPublisher:Cengage Learning
 Intermediate Accounting: Reporting And AnalysisAccountingISBN:9781337788281Author:James M. Wahlen, Jefferson P. Jones, Donald PagachPublisher:Cengage Learning
 Intermediate Financial Management (MindTap Course...FinanceISBN:9781337395083Author:Eugene F. Brigham, Phillip R. DavesPublisher:Cengage Learning
Cornerstones of Financial Accounting
Accounting
ISBN:9781337690881
Author:Jay Rich, Jeff Jones
Publisher:Cengage Learning
Intermediate Accounting: Reporting And Analysis
Accounting
ISBN:9781337788281
Author:James M. Wahlen, Jefferson P. Jones, Donald Pagach
Publisher:Cengage Learning
Intermediate Financial Management (MindTap Course...
Finance
ISBN:9781337395083
Author:Eugene F. Brigham, Phillip R. Daves
Publisher:Cengage Learning
Financial ratio analysis; Author: The Finance Storyteller;https://www.youtube.com/watch?v=MTq7HuvoGck;License: Standard Youtube License