use the sample data below to test the hypotheses Ho : Pi = P2 = P3 H2 : Notall population proportions are equal where p;is the population proportion of Yes responses for population i. using a .05 level of significance, what is the p-value and what is your conclusion? Populations Response 1 2 Yes 150 150 96 No 100 150 104
use the sample data below to test the hypotheses Ho : Pi = P2 = P3 H2 : Notall population proportions are equal where p;is the population proportion of Yes responses for population i. using a .05 level of significance, what is the p-value and what is your conclusion? Populations Response 1 2 Yes 150 150 96 No 100 150 104

College Algebra (MindTap Course List)
12th Edition
ISBN:9781305652231
Author:R. David Gustafson, Jeff Hughes
Publisher:R. David Gustafson, Jeff Hughes
Chapter8: Sequences, Series, And Probability
Section8.7: Probability
Problem 6E: List the sample space of each experiment. Tossing three coins

Related questions
Topic Video
Question
use the sample data below to test the hypotheses
H0 : p1 = p2 = p3 H2 : Not all population proportions are equal
where pi is the population proportion of Yes responses for population i. using a .05 level of significance, what is the p-value, and what is your conclusion?
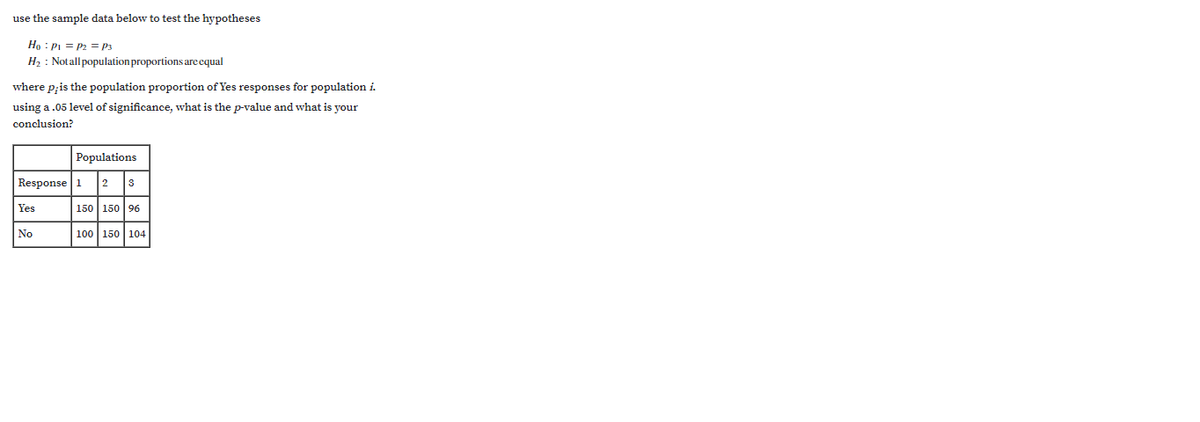
Transcribed Image Text:use the sample data below to test the hypotheses
Ho : Pi = P2 = P3
H2 : Notall population proportions are equal
where p;is the population proportion of Yes responses for population i.
using a .05 level of significance, what is the p-value and what is your
conclusion?
Populations
Response 1
2
Yes
150 150 96
No
100 150 104
Expert Solution
This question has been solved!
Explore an expertly crafted, step-by-step solution for a thorough understanding of key concepts.

This is a popular solution!

Trending now
This is a popular solution!

Step by step
Solved in 4 steps

Knowledge Booster


Learn more about
Need a deep-dive on the concept behind this application? Look no further. Learn more about this topic, statistics and related others by exploring similar questions and additional content below.Recommended textbooks for you
College Algebra (MindTap Course List)
Algebra
ISBN:
9781305652231
Author:
R. David Gustafson, Jeff Hughes
Publisher:
Cengage Learning
College Algebra (MindTap Course List)
Algebra
ISBN:
9781305652231
Author:
R. David Gustafson, Jeff Hughes
Publisher:
Cengage Learning