
Concept explainers
Videos
The race for the 2013 Academy Award for Actress in a Leading Role was extremely tight, featuring several worthy performances (ABC News online, February 22, 2013). The nominees were Jessica Chastain for Zero Dark thirty, Jennifer Lawrence for Silver Linings Playbook, Emmanuelle Riva for Amour, Quvenzhané Wallis for Beasts of the Southern Wild, and Naomi Watts for the Impossible. In a survey, movie fans who had seen each of the movies for which these five actresses had been nominated were asked to select the actress who was most deserving of the 2013 Academy Award for Actress in a Leading Role. The responses follow.
| 18–30 | 31–4 | 45–58 | Over 58 | |
| Jessica Chastain | 51 | 50 | 41 | 42 |
| Jennifer Lawrence | 63 | 55 | 37 | 50 |
| Emmanuelle Riva | 15 | 44 | 56 | 74 |
| Quvenzhané Wallis | 48 | 25 | 22 | 31 |
| Naomi Watts | 36 | 65 | 62 | 33 |
- a. How large was the sample in this survey?
- b. Jennifer Lawrence received the 2013 Academy Award for Actress in a Leading Role for her performance in Silver Linings Playbook. Did the respondents favor Ms. Lawrence? c. at α = .05, conduct a hypothesis test to determine whether people’s attitude toward the actress who was most deserving of the 2013 Academy Award for Actress in a Leading Role is independent of respondent age. What is your Conclusion?
a.
Find the sample size for the given survey.
Answer to Problem 16E
The sample size is 900.
Explanation of Solution
Calculation:
The given observed frequency
| Actress | Age 18-30 | Age 31-44 | Age 45-58 | Age over 58 | Total |
| Jessica Chastain | 51 | 50 | 41 | 42 | 184 |
| Jennifer Lawrence | 63 | 55 | 37 | 50 | 205 |
| Emmanuelle Riva | 15 | 44 | 56 | 74 | 189 |
| Quvenzhane Wallis | 48 | 25 | 22 | 31 | 126 |
| Naomi Watts | 36 | 65 | 62 | 33 | 196 |
| Total | 213 | 239 | 218 | 230 | 900 |
Thus, the sample size is 900.
b.
Explain whether the respondents favor Ms. Lawrence.
Explanation of Solution
Calculation:
Jennifer Lawrence received the 2013 Academy Award for actress in a leading role for “Silver Lining Playbook”.
The sample proportion of movie fan for Jessica Chastain is,
The sample proportion of movie fan for Jennifer Lawrence is,
The sample proportion of movie fan for Emmanuelle Riva is,
The sample proportion of movie fan for Quvenzhane Wallis is,
The sample proportion of movie fan for Naomi Watts is,
It is clear that, the sample proportion for Jennifer Lawrence is highest. Thus, the respondents favor Ms. Lawrence. However, Jessica Chastain, Emmanuelle Riva and Naomi Watts were also favored by almost as many of fans.
c.
Perform a hypothesis test to determine whether people’s attitude toward the actress who was most deserving of the 2013 Academy Award for Actress in a Leading Role is independent of respondent age at 5% level of significance and draw conclusion of the study.
Answer to Problem 16E
The data provide sufficient evidence to conclude that people’s attitude toward the actress who was most deserving of the 2013 Academy Award for Actress in a Leading Role is not independent of respondent age.
Explanation of Solution
Calculation:
State the test hypotheses.
Null hypothesis:
That is, people’s attitude toward the actress who was most deserving of the 2013 Academy Award for Actress in a Leading Role is independent of respondent age.
Alternative hypothesis:
That is, people’s attitude toward the actress who was most deserving of the 2013 Academy Award for Actress in a Leading Role is not independent of respondent age.
The row and column total is tabulated below:
| Actress | Age 18-30 | Age 31-44 | Age 45-58 | Age over 58 | Total |
| Jessica Chastain | 51 | 50 | 41 | 42 | 184 |
| Jennifer Lawrence | 63 | 55 | 37 | 50 | 205 |
| Emmanuelle Riva | 15 | 44 | 56 | 74 | 189 |
| Quvenzhane Wallis | 48 | 25 | 22 | 31 | 126 |
| Naomi Watts | 36 | 65 | 62 | 33 | 196 |
| Totals | 213 | 239 | 218 | 230 | 900 |
The formula for expected frequency is given below:
The expected frequency for each category is calculated as follows:
| Actress | Age 18-30 | Age 31-44 | Age 45-58 | Age over 58 |
| Jessica Chastain | ||||
| Jennifer Lawrence | ||||
| Emmanuelle Riva | ||||
| Quvenzhane Wallis | ||||
| Naomi Watts |
The formula for chi-square test statistic is given as,
The value of chi-square test statistic is,
Thus, the chi-square test statistic is 77.74.
Degrees of freedom:
The degrees of freedom are
In the given problem
Therefore,
Level of significance:
The given level of significance is
p-value:
Software procedure:
Step -by-step software procedure to obtain p-value using MINITAB software is as follows:
- Select Graph > Probability distribution plot > view probability
- Select chi-square under distribution and enter 12 in degrees of freedom.
- Choose X-Value and Right Tail for the region of the curve to shade.
- Enter the X-value as 77.74 under shaded area.
- Select OK.
- Output using MINITAB software is given below:
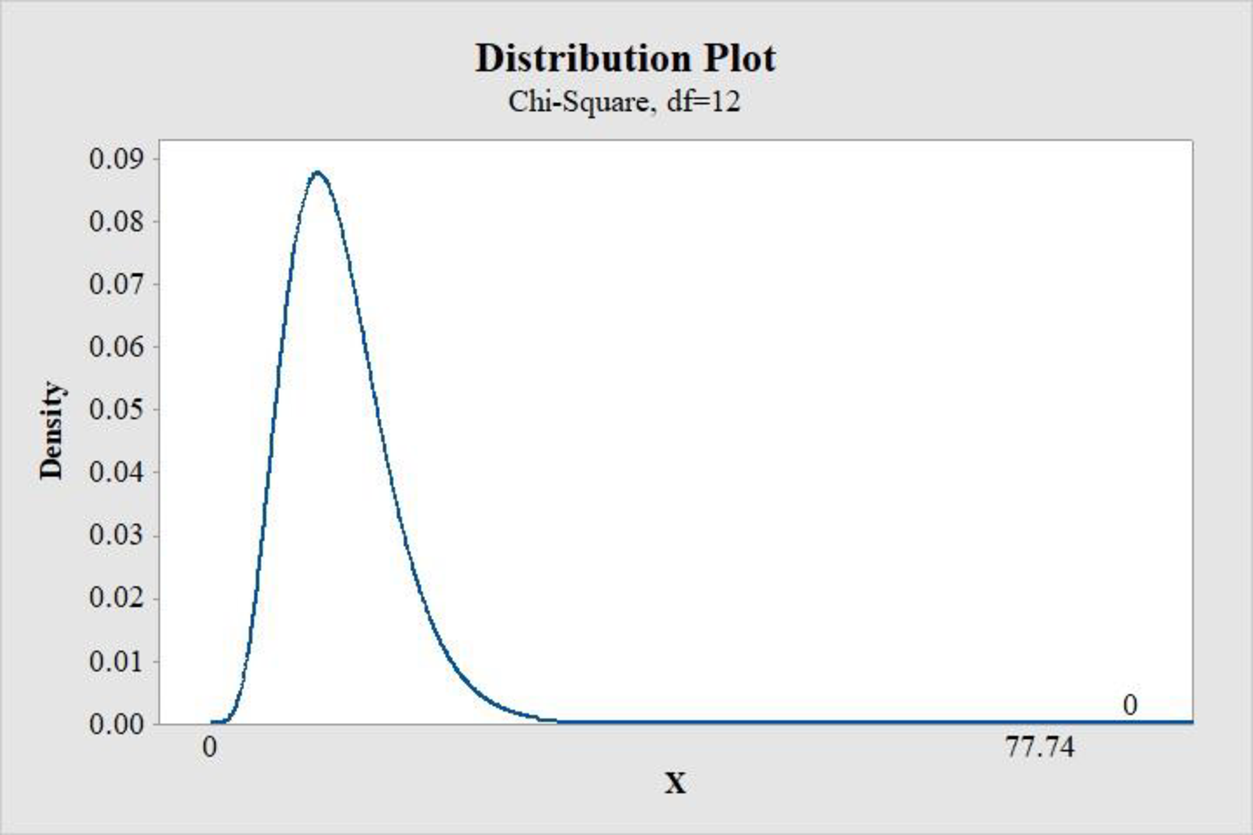
From the MINITAB output, the p-value is 0.
Rejection rule:
If the
Conclusion:
Here, the p-value is less than the level of significance.
That is,
Thus, the decision is “reject the null hypothesis”.
Therefore, the data provide sufficient evidence to conclude that column variable is not independent of row variable. That is, there is an association between column and row variable.
Thus, the data provide sufficient evidence to conclude that people’s attitude toward the actress who was most deserving of the 2013 Academy Award for Actress in a Leading Role is not independent of respondent age.
Want to see more full solutions like this?
Chapter 12 Solutions
STATISTICS F/BUSINESS+ECONOMICS-TEXT


- Studies show that about 18 percent of all businesses in the United States are minority-owned.Brian lives in Centerville, a town with a population of 25,000 and 200 businesses. Assuming that the national percentage holds true for the businesses in Centerville, how many of these are minority-owned?arrow_forwardHillary and Adams, Inc., is a privately owned firm located in Atlanta that serves as the regional distributor of natu-ral food products for Georgia, Kentucky, North Carolina, South Carolina, and Tennessee. They are particularlywell known for their unique blend of fiery hot Habanera sauces. Every week, a truck leaves the large distributioncenter in Atlanta to stock local warehouses located in Charlotte, North Carolina; Charleston, South Carolina;Columbia, South Carolina; Knoxville, Tennessee; Lexington, Kentucky; and Raleigh, North Carolina. The truckvisits each local warehouse only once and returns to Atlanta after all the deliveries have been completed. Thedistance between any two cities in miles is given below John Jensen, vice president of logistics at Hillary and Adams, Inc., is worried about the rising fuel costs.With a reduction in operating budgets, he is interested in finding a route that would minimize the distance trav-eled by the truck.Use the NN heuristic to identify a…arrow_forwardA health researcher studying child birth is interested in the possible effect that smoking by the mother during pregnancy has on the baby's birth weight. To investigate, the researcher conducts an observational study by reviewing 400 records of women in their twenties who have recently given birth for the first time. For each record, he notes whether or not the woman smoked during pregnancy and the baby's birth weight, in addition to the woman's education level, and age. From the data, the researcher creates two groups: women in their twenties who smoked during pregnancy and women in their twenties who did not smoke during pregnancy. Then he compares the average birth weight between the two groups. (a)Why might the researcher have chosen to perform an observational study (by gathering information from past records) and not a randomized experiment (by assigning pregnant women to either the smoking or nonsmoking group at random)? Choose the best answer from the choices below. In a…arrow_forward
- At the end of a rock concert, representatives of the featured performer randomly selected 50 of the attendees and had them fill out a survey that asked them if they had a positive, negative, or neutral impression of the performer's latest song. The performer's representatives then tabulated the results and concluded that exactly 82% of those surveyed had a positive impression of the song, exactly 8% had a negative impression, and exactly 10% had a neutral impression. Which of these was most likely the purpose of the survey? A. To estimate the percentages of all rock music fans who have a positive, negative, and neutral impression of the song. B. To estimate the percentages of all the performer's fans who have a positive, negative, and neutral impression of the song. C. To determine the exact percentages of all rock music fans who have a positive, negative, and neutral impression of the song. D. To determine the exact percentages of all the performer's fans who have a positive,…arrow_forwardA chef is trying out a new recipe he has been working on and wants to see if it will sell better than his old one. To find out, he performs an experiment where he randomly assigns 20 people to try his new recipe and 20 people to try his old one. He asks each group how much they would be willing to pay for their food, and he finds that the group with the old recipe would pay an average of $20.00 and the second would pay an average of $26.00. He then performs an independent samples t-test between these groups. a. Suppose the sample variance for the price of the chef’s old recipe is $2.00, and the sample variance for the new recipe is $3.00. Perform a one-tailed t-test at a significance level of α = 0.01 and explain what the result means (how does the new recipe compare to the old one?). b. To evaluate the magnitude of effect size, compute the estimated Cohen’s d. Briefly describe what it means, and comment on the strength of the effect: is it weak, moderate or strong?arrow_forwardIn 1975, the automobile industry determined that 40% of American car owners drove large cars, 20% drove intermediate-sized cars, and 40% drove small cars. A second survey in 1985 showed that 70% of the largecar owners in 1975 still owned large cars in 1985, but 30% had changed to an intermediate-sized car. Of those who owned intermediate-sized cars in 1975, 10% had switched to large cars, 70% continued to drive intermediate-sized cars, and 20% had changed to small cars in 1985. Finally, of the small-car owners in 1975, 10% owned intermediate-sized cars and 90% owned small cars in 1985. Assuming that these trends continue, determine the percentages of Americans who own cars of each size in 1995 and the corresponding eventual percentages.arrow_forward
- in a certain city, 60% of the heads of household own the house in which they reside, and 80% of the heads of the household have full-time employment when considering what percentage of heads of household both own their home and have a full-time job, a student estimates that 48% of heads of household fit both requirements, stating that (0.60) (0.80)=0.48. is this student correct in his approach?arrow_forwardThe trend in home building in recent years has been to emphasize open spaces and great rooms, rather than smaller living rooms and family rooms. A builder of speculative homes in the college community of Oxford, Ohio, had been building such homes, but his homes had been taking many months to sell and had been selling for substantially less than the asking price. In order to determine what types of homes would attract residents of the community, the builder contacted a statistician at a local college. The statistician went to a local real estate agency and obtained the data contained in file OxHome. This data includes the sales price (measured in thousand dollars), square footage, number of rooms, number of bedrooms, and age for each of 60 single-family residences recently sold in the community. Using this data, a regression model was built to predict the sales price of houses in this community. The regression equation from the model is: sales price (thousand dollars) = 19.5 + 0.1079…arrow_forwardThe trend in home building in recent years has been to emphasize open spaces and great rooms, rather than smaller living rooms and family rooms. A builder of speculative homes in the college community of Oxford, Ohio, had been building such homes, but his homes had been taking many months to sell and had been selling for substantially less than the asking price. In order to determine what types of homes would attract residents of the community, the builder contacted a statistician at a local college. The statistician went to a local real estate agency and obtained the data contained in file OxHome. This data includes the sales price (measured in thousand dollars), square footage, number of rooms, number of bedrooms, and age for each of 60 single-family residences recently sold in the community. Using this data, a regression model was built to predict the sales price of houses in this community. The regression equation from the model is: sales price (thousand dollars) = 19.5 + 0.1079…arrow_forward
- The trend in home building in recent years has been to emphasize open spaces and great rooms, rather than smaller living rooms and family rooms. A builder of speculative homes in the college community of Oxford, Ohio, had been building such homes, but his homes had been taking many months to sell and had been selling for substantially less than the asking price. In order to determine what types of homes would attract residents of the community, the builder contacted a statistician at a local college. The statistician went to a local real estate agency and obtained the data contained in file OxHome. This data includes the sales price (measured in thousand dollars), square footage, number of rooms, number of bedrooms, and age for each of 60 single-family residences recently sold in the community. Using this data, a regression model was built to predict the sales price of houses in this community. The regression equation from the model is: sales price (thousand dollars) = 19.5 + 0.1079…arrow_forwardSuppose 60 percent of the customers at Pizza Palooza order a square pizza, 80 percent order a soft drink, and 48 percent order both a square pizza and a soft drink. Is ordering a soft drink independent of ordering a square pizza?arrow_forwardGloria operates three self-service gasoline stations in different parts of town. On a certain day, station A sold 600 liters of premium, 800 liters of super, 1000 liters of regular gasoline, and 700 liters of diesel fuel; station B sold 700 liters of premium, 600 liters of super, 1200 liters of regular gasoline, and 400 liters of diesel fuel; station C sold 900 liters of premium, 700 liters of super, 1400 liters of regular gasoline, and 800 liters of diesel fuel. Assume that the price of gasoline was Sh3.80/liters for premium, Sh3.60/liters for super, and Sh3.40/liters for regular and that diesel fuel sold for Sh3.70/liters. Use matrix algebrato find the total revenue at each station.arrow_forward
 MATLAB: An Introduction with ApplicationsStatisticsISBN:9781119256830Author:Amos GilatPublisher:John Wiley & Sons Inc
 Probability and Statistics for Engineering and th...StatisticsISBN:9781305251809Author:Jay L. DevorePublisher:Cengage Learning
 Statistics for The Behavioral Sciences (MindTap C...StatisticsISBN:9781305504912Author:Frederick J Gravetter, Larry B. WallnauPublisher:Cengage Learning
 Elementary Statistics: Picturing the World (7th E...StatisticsISBN:9780134683416Author:Ron Larson, Betsy FarberPublisher:PEARSON
 The Basic Practice of StatisticsStatisticsISBN:9781319042578Author:David S. Moore, William I. Notz, Michael A. FlignerPublisher:W. H. Freeman
 Introduction to the Practice of StatisticsStatisticsISBN:9781319013387Author:David S. Moore, George P. McCabe, Bruce A. CraigPublisher:W. H. Freeman