
Videos
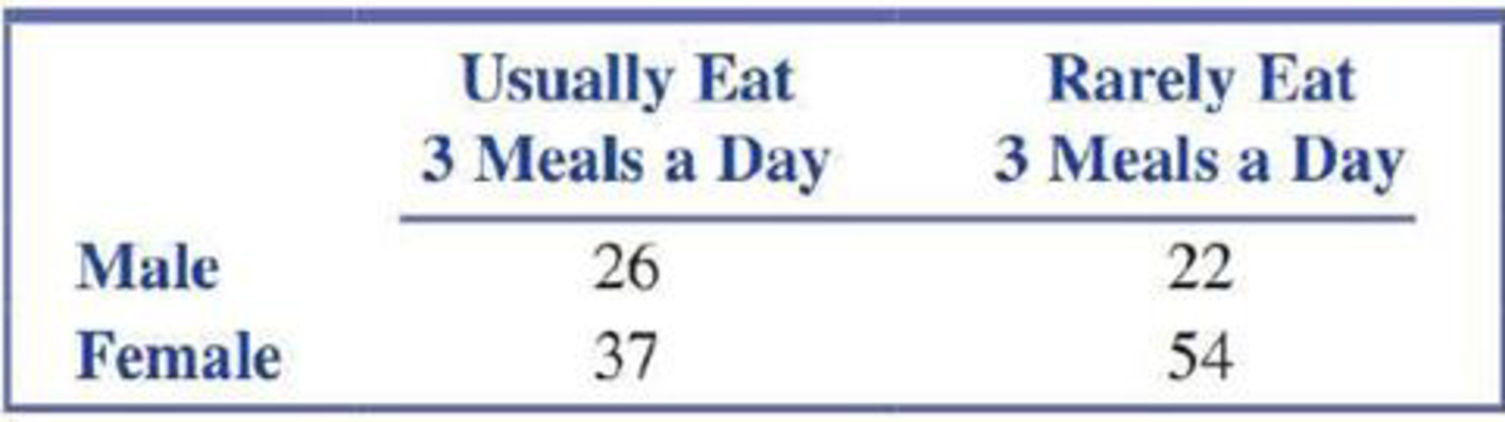
The data summarized in the accompanying table are from the paper “Gender Differences in Food Selections of Students at a Historically Black College and University” (College Student Journal [2009]: 800–806). Suppose that the data resulted from classifying each person in a random sample of 48 male students and each person in a random sample of 91 female students at a particular college according to their response to a question about whether they usually eat three meals a day or rarely eat three meals a day.
- a. Is there evidence that the proportions falling into each of the two response categories are not the same for males and females? Use the X2 statistic to test the relevant hypotheses with a significance level of 0.05.
- b. Are the calculations and conclusions from Part (a) consistent with the accompanying Minitab output?
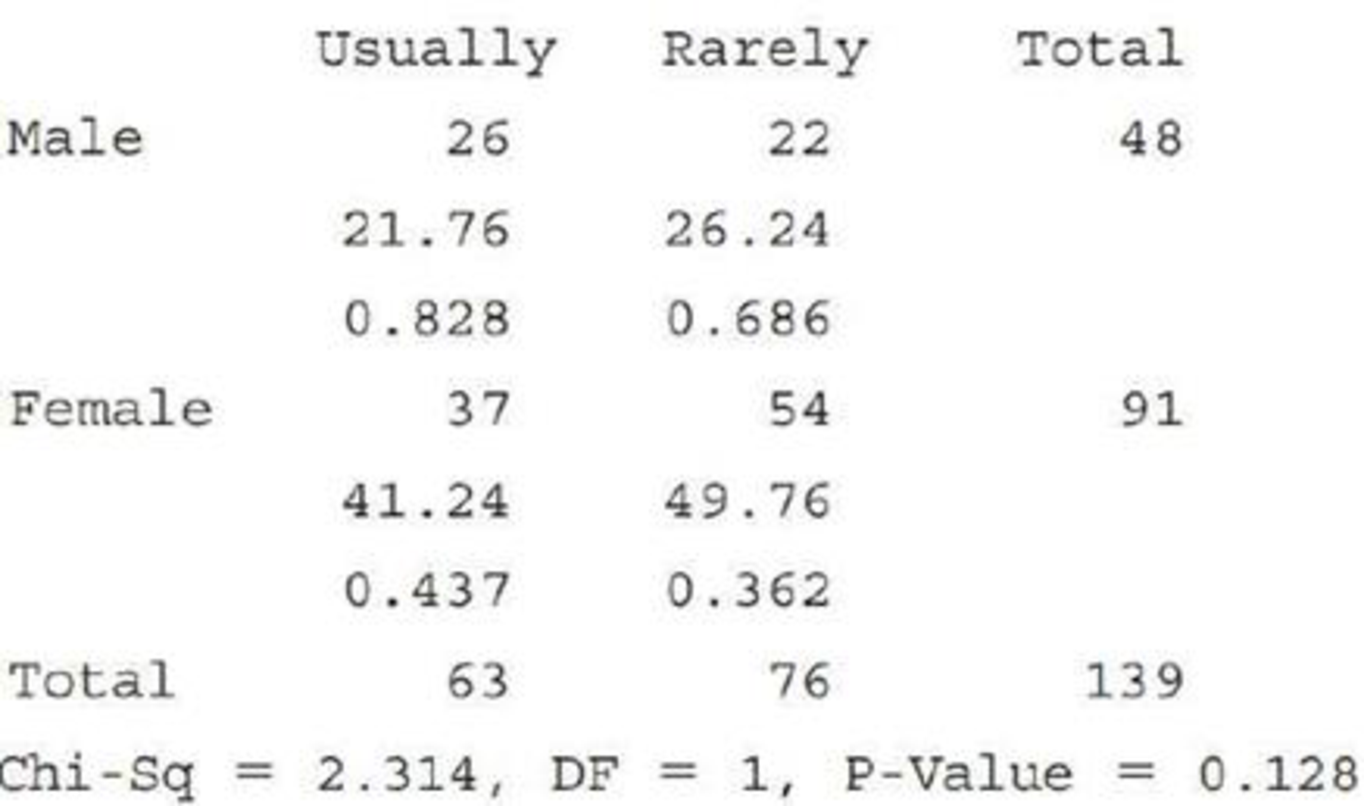
Expected counts are printed below observed counts
Chi-Square contributions are printed below expected counts
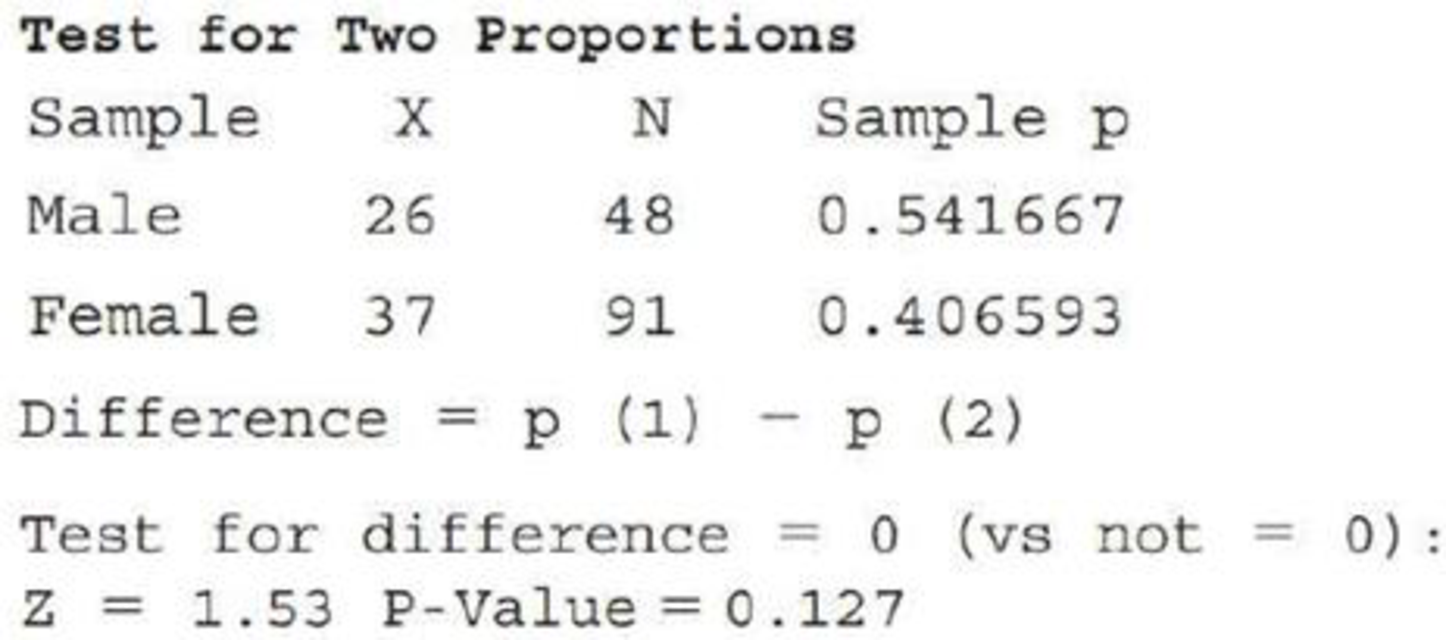
- c. Because the response variable in this exercise has only two categories (usually and rarely), we could have also answered the question posed in Part (a) by carrying out a two-sample z test of H0: p1 − p2 = 0 versus Ha: p1 − p2 ≠ 0, where p1 is the proportion who usually eat three meals a day for males and p2 is the proportion who usually eat three meals a day for females. Minitab output from the two-sample z test is shown below. Using a significance level of 0.05, does the two-sample z test lead to the same conclusion as in Part (a)?
- d. How do the P-values from the tests in Parts (a) and (c) compare? Is this surprising? Explain.
a.
Test whether the proportions falling into each of the two response categories for males and females are same or not.
Answer to Problem 25E
There is no convincing evidence that the proportions falling into each of the two response categories for males and females are not same.
Explanation of Solution
Given table represents classification of male and female students according to their response about whether they usually eat three meals a day or rarely eat three meals a day.
In order to test the proportions falling into each of the two response categories for males and females are same or not, the appropriate test is
The steps in chi-square test for homogeneity is as follows.
Null and alternative Hypotheses:
Null hypothesis:
Alternative hypothesis:
Level of significance:
Assumptions:
- It is given that data resulted from classifying each person in a random sample of male and female students at a particular college.
- The expected cell counts are calculated as shown below.
| Usually eat 3 meals a day | Rarely eat 3 meals a day | Total | |
| Male | 48 | ||
| Female | 91 | ||
| Total | 63 | 76 | 139 |
From the expected cell counts table, it is observed that all the expected counts are greater than 5.
Test Statistic:
Chi-square statistic:
Degrees of freedom:
Here, number of rows is 2 and the number of columns is 2. The degrees of freedom is calculated as follows.
From the calculations,
P-value:
From Table 8-Upper-Tail Areas for Chi-Square Distributions, the Right-tail area is greater than 0.100 for the chi-squared values that are less than 2.70.
Thus, P-value > 0.100.
Decision rule:
- If P-value is less than or equal to the level of significance, reject the null hypothesis.
- Otherwise fail to reject the null hypothesis.
Conclusion:
Here the level of significance is 0.05.
Here, P-value is greater than the level of significance.
That is,
Therefore, fail to reject the null hypothesis. Therefore, there is no convincing evidence that the proportions falling into each of the two response categories for males and females are not same.
b.
Check whether the calculations and conclusions from Part (a) consistent with the accompanying Minitab output.
Explanation of Solution
From Part (a), the chi-square value obtained is
In the given MINITAB output, chi-square value is 2.314 and P-value is 0.128.
Since,
Hence, the calculations and conclusions from Part (a) consistent with the accompanying Minitab output.
c.
Check whether the two-sample z test lead to the same conclusion as in Part (a).
Answer to Problem 25E
The two-sample z test lead to the same conclusion as in Part (a).
Explanation of Solution
From the given output for test for two proportions,
Conclusion:
Here the level of significance is 0.05.
Here, P-value is greater than the level of significance.
That is,
Therefore, fail to reject the null hypothesis. Therefore, there is no convincing evidence that the proportions falling in the two response categories are not same for males and females.
Thus, the two-sample z test lead to the same conclusion as in Part (a).
d.
Explain the comparison of P-values from the tests in Parts (a) and (c).
Explanation of Solution
The P-value obtained in Part (a) is greater than 0.100. And, the P-value obtained in Part (c) is 0.127.
There is some difference in P-value. But both are greater than 0.100.
This is not surprising as both chi-square statistic and z-statistic measure the probability of getting sample proportions that are far from the expected proportions under null hypothesis.
Want to see more full solutions like this?
Chapter 12 Solutions
Introduction To Statistics And Data Analysis


 Holt Mcdougal Larson Pre-algebra: Student Edition...AlgebraISBN:9780547587776Author:HOLT MCDOUGALPublisher:HOLT MCDOUGAL