
Concept explainers
Videos
Inflation The following graph shows the approximate value of the U.S. Consumer Price Index (CPI) from March 2006 through May 2007.
CPI Mar 2006-May 2007
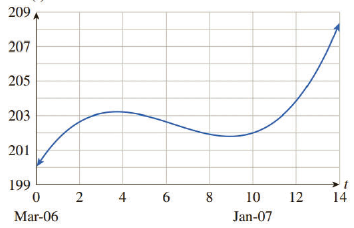
The approximating curve shown on the figure is given by
where t is time in months since the start of July 2005.
a. Use the model to estimate the monthly inflation rate in September 2006 and January 2007
b. Was inflation slowing or speeding up in January 2007?
c. When was inflation speeding up? When was inflation slowing? [HINT: See Example 3.]
Want to see the full answer?
Check out a sample textbook solution
Chapter 12 Solutions
Finite Mathematics and Applied Calculus (MindTap Course List)


- Inflation Assuming that the annual rate of inflation averages 4 over the next 10 years, the approximate costs C of goods or services during any year in that decade can be modeled by Ct=P1.04t, where t is the time in years and P is the present cost. The price of an oil change for your car is presently $29.88. Estimate the price 10 years from now.arrow_forwardaThe average rate of change of a function f between x=a and x=b is the slope of the ___________ line between (a,f(a)) and (b,f(b)).arrow_forwardSales Growth In this exercise, we develop a model for the growth rate G, in thousands of dollars per year, in sales of the product as a function of the sales level s, in thousands of dollars. The model assumes that there is a limit to the total amount of sales that can be attained. In this situation, we use the term unattained sales for difference this limit and the current sales level. For example, if we expect sales grow to 3 thousand dollars in the long run, then 3-s is the unattained sales. The model states that the growth rate G is proportional to the product of the sales level s, and the unattained sales. Assume that the constant of proportionality is 0.3 and that the sales grow to 2 thousand dollars in the long run. a.Find the formula for unattained sales. b.Write an equation that shows the proportionality relation for G. c.On the basis of the equation from the part b, make a graph of G as a function of s. d.At what sales level is the growth rate as large as possible? e.What is the largest possible growth rate?arrow_forward
- 5-6 Yes or No? If No, give a reason aIs the average rate of change of a function between x=a and x=b the slope of the secant line through (a,f(a)) and (b,f(b))?arrow_forwardPopulation Growth and Decline The table gives the population in a small coastal community for the period 1997-2006. Figures shown arc for January 1 in each year. (a) What was the average rate of change of population between 1998 and 2001? (b) What was the average rate of change of population between 2002 and 2004? (C) For what period of lime was the population increasing? (d) For what period of time was the population decreasing?arrow_forwardGrazing Kangaroos The amount of vegetation eaten in a day by a grazing animal V of food available measured as biomass, in units such as pounds per acre. This relationship is called the functional response. If there is little vegetation available, the daily intake will be small, since the animal will have difficulty finding and eating the food. As the amount of food biomass increases, so does the daily intake. Clearly, though, there is a limit to the amount the animal will eat, regardless of the amount of food available. This maximum amount eaten is the satiation level. a.For the western grey kangaroo of Australia, the functional response is G=2.54.8e0.004V, where G=G(V) is the daily intake measured in pounds and V is the vegetation biomass measured in pounds per acre. i. Draw a graph of G against V. Include vegetation biomass levels up to 2000 pounds per acre. ii. Is the graph you found in part i concave up or concave down? Explain in practical terms what your answer means about how this kangaroo feeds. iii. There is a minimal vegetation biomass level below which the western grey kangaroo will eat nothing. Another way of expressing this is to say that the animal cannot reduce the food biomass below this level. Find this minimal level. iv. Find the satiation level for the western grey kangaroo. b. For the red kangaroo of Australia, the functional response is R=1.91.9e0.033V, Where R is the daily intake measured in pounds and V is the vegetation biomass measured in pounds per acre. i. Add the graph of R against V to the graph of G you drew in part a. ii. A simple measure of the grazing efficiency of an animal involves the minimal vegetation biomass level described above: The lower the minimal level for an animal, the more efficient it is at grazing. Which is more efficient at grazing, the western grey kangaroo or the red kangaroo?arrow_forward
- Decay of Litter Litter such as leaves falls to the forest floor, where the action of insects and bacteria initiates the decay process. Let A be the amount of litter present, in grams per square meter, as a function of time t in years. If the litter falls at a constant rate of L grams per square meter per year, and if it decays at a constant proportional rate of k per year, then the limiting value of A is R=L/k. For this exercise and the next, we suppose that at time t=0, the forest floor is clear of litter. a. If D is the difference between the limiting value and A, so that D=RA, then D is an exponential function of time. Find the initial value of D in terms of R. b. The yearly decay factor for D is ek. Find a formula for D in term of R and k. Reminder:(ab)c=abc. c. Explain why A=RRekt.arrow_forwardSpecial Rounding Instructions For this exercise set, round all regression parameters to three decimal places but round all other answers to two decimal places unless otherwise indicated. Grazing Rabbits The amount A of vegetation measured in pounds eaten in a day by a grazing animal is a function of the amount V of food available measured in pounds per acre. Even if vegetation is abundant, there is a limit, called the satiation level, to the amount the animal will eat. The following table shows, for rabbits, the difference D between the satiation level and the amount A of food eaten for a variety of values of V. V=vegetaionlevel D=satiationlevel-A 27 0.16 36 0.12 89 0.07 134 0.05 245 0.01 a.Draw a plot of D versus V. b.Find an exponential function that approximates D. c.The satiation level of a rabbit is 0.18 pound per day. Use this, together with your work in part b, to find a formula for A. d.Find the vegetation level V for which the amount of food eaten by the rabbit will be 90 of its satiation level of 0.18 pound per day.arrow_forward
 Algebra and Trigonometry (MindTap Course List)AlgebraISBN:9781305071742Author:James Stewart, Lothar Redlin, Saleem WatsonPublisher:Cengage Learning
 Trigonometry (MindTap Course List)TrigonometryISBN:9781337278461Author:Ron LarsonPublisher:Cengage Learning
 College AlgebraAlgebraISBN:9781305115545Author:James Stewart, Lothar Redlin, Saleem WatsonPublisher:Cengage Learning
 Functions and Change: A Modeling Approach to Coll...AlgebraISBN:9781337111348Author:Bruce Crauder, Benny Evans, Alan NoellPublisher:Cengage Learning
 Algebra & Trigonometry with Analytic GeometryAlgebraISBN:9781133382119Author:SwokowskiPublisher:Cengage