
Concept explainers
Videos
Scientific Research: 1983–2003 The percentage of research articles in the prominent journal Physical Review that were written by researchers in Europe during 1983–2003 can be modeled by
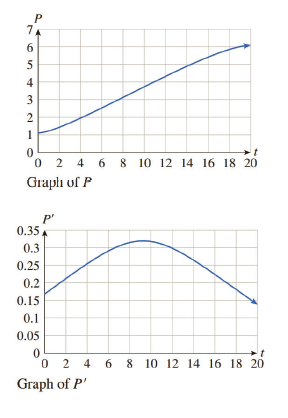
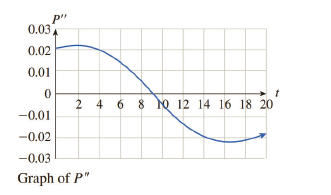
Determine, to the nearest whole number, the values of t for which the graph of P is concave up and where it is concave down, and locate any points of inflection. What does the point of inflection tell you about science articles? [HINT: See Example 4.]

Trending nowThis is a popular solution!

Chapter 12 Solutions
Finite Mathematics and Applied Calculus (MindTap Course List)


- World Crude Oil Production In 1956, M.King Hubbert proposed a model to analyse crude oil production. His model, with updated data, gives world crude oil production as P=254.43e0.042t(1+2.12e0.042t)2 Here P is measured in billions of barrels per year, and t is time, in year, since 2000. a.Make a graph of world crude oil production for 2000 through 2040. b.When does this model predict a peak in world crude oil production? c.What is the maximum crude oil production predicted by this model?arrow_forward1.Criticize the discrete population model and the continuous Malthus model. 2. To the discrete population model for P with constant birth and death rates add a constant positive migration rate M. a) Formulate the equation. b) Explicitly solve it using P(0)=P0arrow_forwardIf P(t) denotes the population at time t and A(t) denotes the average annual income, then T(t) = P(t)A(t) is the total personal income. In this exercise, we estimate the rate at which the total personal income is rising in a town in Colorado. In 2015, the population of this city was 107,300, and the population was increasing by roughly 1,920 people per year. The average annual income was $60,270 per capita, and this average was increasing at about $2,500 per year (a little above the national average of about $1,810 yearly). Use the Product Rule and these figures to estimate the rate at which total personal income was rising (in millions of dollars per year) in the city in 2015. (Round your answer to the nearest whole number.) $ million per yeararrow_forward
- The population of a virus follows the growth modeldPdt =aK(P − M)(K − P)where 0 < M < K and a > 0 are constants and P(t) denotes the populationat time t. Solve the model to find P(t) when t → ∞.arrow_forwardchapter 5.1 - antidifferentiation - #44 a particle travels along the x-axis in such as a way that its acceleration at time t is a(t) = square root of x +t2 . if it starts at the origin with its iinitial velocity of 2 (that is s(0) = 0) and V(0) = 2 determine its position and velocity when t = 4.arrow_forwarddisposable income is the amount available for spending and saving after taxes have been paid and is one gauge for the state of the economy. using US energy administration data for selected years from 2010 and projected to 2040, the total US disposable income, in billions, can be modeled by D(t) = 10,020e^0.02292t where t is the number of years past 2010. in what year is disposable income predicted to be $15 trillion (that is, $15,000 billion)arrow_forward
- J 1 A model summary of the same model (4c) is given below what conclusion can you drawn from these resultsarrow_forwardA streetlight is mounted at the top of a pole. A man walks away from the pole. How is the rate at which he walks away from the pole, and the rate at which his shadow grows, related? a. Both rates are equal. b. The relationship depends on how close the man is to the pole. c. One is a constant multiplier of the other.arrow_forward5. An oil slick caused by a leaking tanker in a well-traveled shipping lane offshore is roughly circular in shape, with a current diameter of 150 meters. Since the area of a circle with diameter D is found by geometry to equal A = π4 D2, it follows that the area of the slick is currently 17,671 square meters. (a) If the slick spreads out so that the diameter increases 2 meters every hour, give a formula for D in terms of t = time, in hours from now. (b) Use function composition to find a formula for the area A of the slick in terms of time t, then use this formula to determine the area of the slick after 12 hours.arrow_forward
- find the solution of the given initial value problem. Sketch the graph of the solution and describe its behavior as t increases. y″ + y′ − 2y = 0, y(0) = 1, y′(0) = 1 6y″ − 5y′ + y = 0, y(0) = 4, y′(0) = 0 4y″ − y = 0, y(−2) = 1, y′(−2) = −1arrow_forwardAssume that dx1/dt= x1(10-2x1-x2) dx2/dt= x2(10-x1-2x2) a) Graph the zero isoclines. b) Show that (10/3, 10/3) is an equilibrium, and use the analytical approach to determine its stability.arrow_forwardneglact At)tarrow_forward
 Algebra & Trigonometry with Analytic GeometryAlgebraISBN:9781133382119Author:SwokowskiPublisher:Cengage
 Functions and Change: A Modeling Approach to Coll...AlgebraISBN:9781337111348Author:Bruce Crauder, Benny Evans, Alan NoellPublisher:Cengage Learning