
Concept explainers
a
To plot:
Graphical representation of production frontier.
a
Explanation of Solution
The utility function is given by as-
The budget line is given as:
With the help of Langraingian expression this problem can be explained as:
Taking the differentials w.r.t x,y and
Demand for x is given by:
Demand for y is given as:
His or her demand for x and y depends on relative prices of these value.
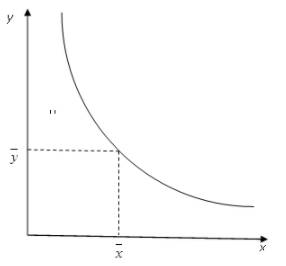
Graph 1
Introduction:
Utility is the amount of satisfaction derived for consumption of goods or services. It is usually measured in utils.
b)
To find:
Quantity of x and y to be produced.
b)
Explanation of Solution
The total available goods are 1000. From the equilibrium condition is given as-
Now put this value of x in the budget equation:
Now put this value of x in the budget equation:
Here
The total endowment is 1000. So, y = 500 and x = 500
Introduction:
Indifference curve is a curve which represents combination of goods which gives equal satisfaction.
c)
To know:
RPT and price ratio of
c)
Explanation of Solution
For this
The equation shows the pareto optimal allocation. It is given that
y = 500 and x = 500
The price ratio can be calculated as follows:
This expression shows pareto efficient condition.
Introduction:
Marginal Rate of technical substitution is the rate at which one factor of input can be substituted for another input, output remaining same. It shows efficiency of inputs for productivity.
Indifference curve is a curve which represents combination of goods which gives equal satisfaction.
d)
To find:
Price ratio and MRS.
d)
Explanation of Solution
Suppose total amount of the product be allocated between x and y with respect to x=600 and y = 400. The given utility function is given as:
So, the MRS is given as:
It is known that marginal rate of substitution is equal to price ratio = 0.67
Introduction:
Marginal Rate of technical substitution is the rate at which one factor of input can be substituted for another input, output remaining same. It shows efficiency of inputs for productivity.
Indifference curve is a curve which represents combination of goods which gives equal satisfaction.
Want to see more full solutions like this?
Chapter 13 Solutions
Microeconomic Theory


- a) Consider a couple whose behaviour follows the unitary household model. Their preferences can be represented by the utility function: U(CM; CH) = min (CM, CH), where CM, denotes market goods and CH denotes home production. Each spouse can work up to 50 hours per week, and those 50 hours can be divided between market work and home production. Joe and Anna are each paid £20 per hour for market work. Joe produces £20 of home production per hour, while Anna produces £30 per hour of home production. How many hours are each of the spouses allocating to home production and market work? b) Suppose that Anna is offered a pay raise, so that her hourly market wage increases to £25, and nothing else changes. Will that change the identity of the spouse who works more hours on the market? Explain your answer. [Hint there is no need to calculate the full solution to this case]arrow_forwardConsider an economy composed of 16 consumers. Of these, 5 consumers each own one right shoe and 11 consumers each own one left shoe. Shoes are indivisible. Everyone has the same utility function, which is Min(2R, L}, where R and L are, respectively, the quantities of right and left shoes con sumed. A) (10%) Is the status quo (where each individual has his own shoe) Pareto efficient? If so, briefly explain why. If not, provide a Pareto improvement b) (10%) Characterize all Pareto efficient allocationsarrow_forwardNeed help on part (d) and (e) 6. Assume you can work as many hours you wish at £12 per hour (net of tax). If you do not work, you have no income. You have no ability to borrow or lend, so your consumption, c, is simply equal to your income. a) Derive and plot the feasible set, between daily values of consumption c, and “leisure”, l. Label the values at the intercepts (the points where the feasible frontier cuts the two axes). b) Assume that your optimal choice of consumption and leisure is to work 8 hours per day. Illustrate this choice diagrammatically using the feasible set and indifference curves. c) Use indifference curves and the feasible set to show why, given the properties of the optimal choice in part b), it is not optimal to work, say, 10, or 6 hours per day. d) Now assume that you receive an income of £140 per week from an unknown benefactor. Show the impact on your feasible set, and show a new optimal choice in which consumption increases but labour supply decreases.…arrow_forward
- Consider a two-person exchange economy in which person 1 owns 200 units of x and 100 units of y while person 2 owns 100 units of x and 200 units y. Suppose their preferences over the two goods can be represented as: U1 (x, y) = y + 50Inx U2 (x, y) = y + 150lnx 1. How much of x do they trade among each other? 2. Does the First Welfare Theorem (FWT) hold in this economy?arrow_forwardConsider an economy where all production and all consumption is carried out by a single agent, Robinson Crusoe. Robinson, as a consumer, is endowed with H hours of time. His utility depends in hours of leisure, h, and coconuts, y: u(h, y) = (h)1−βyβ with 0 ≤ h ≤ H,β ∈ (0,1). Robinson, as a firm, can transform hours of labor, z, into coconuts y. His technology of production is given by y = f(z) = zα with α ∈ (0, 1). Let p denote the price of coconuts, w denote the price of leisure/labor, and π denote the firm’s profits. Note that the budget constraint of Robinson is py ≤ w(H − h) + π. Note that the budget constraint of Robinson is px ≤ w(H − h) + π, and that in equilibrium in the market of coconuts x = y and in the labor market h + z = H. Find the equilibrium allocation and price vector in equilibrium.arrow_forwardConsider a two-city (A and B) regional economy where each city operates on the negatively sloped portion of its utility curve. In the initial equilibrium, the two cities are identical. Then air pollution (lead emissions) in city B decreases the brain power and productivity of workers in the city by 20 percent. Illustrate the effects of lead emissions on the regional equilibrium, indicating the direction of changes in city size (the number of workers) and regional utility.arrow_forward
- Assume you are spending your full budget and purchasing such amounts of X and Y that the marginal utility from the last units consumed is 40 and 20 utils respectively. Assume (a) the prices of X and Y are $8 and $4 respectively; (b) it takes 3 hours to consume a unit of X and 1 hour to consume a unit of Y; and (c) your time is worth $2 per hour. In equilibrium, if you included the opportunity cost of time then, you should substitute X for Y until the marginal utility per hour is the same for both products. should consume X and Y in the equal amounts. should consume less of Y and more of X. should consume less of X and more of Y.arrow_forwardSuppose that every consumer is on his/her budget constraint where MRS = 0.1, the price of good X is $2, the price of good Y is $1 and firms are operating on the PPF where MRT = 4. Assume the PPF is concave. To increase efficiency, consumers should consume [more, less , the same amount] of good X; [ore, less, the same amount] of good Y. To increase efficiency, firms should produce ["", "", ""] of good X; ["", "", ""] of good Y.arrow_forwardThe U.S. imports lumber among other goods from Canada. The lumber has been the topic of political dialogue between the 2 countries in the past few days. So let’s take X as ‘lumber’ and Y as ‘other goods’. Suppose the Canadian lumber and other exportable goods are produced with the following production Possibilities frontier (PPF): X2 + Y2 = 900 Suppose the U.S. utility function for the Canadian lumber, X, and other exportable goods, Y, is: U = X Y a. Derive the conditions necessary to determine the ‘Optimal Product Mix’ discussed in chapter 10. b. Draw the PPF (partial just the first quadrant) with Y on the vertical axis. On the same graph, draw at least one indifference curve so as to show the “optimal product mix’. Can this graph represent the ‘pure exchange’ economy? Explain why or why not. c. Now draw in a price line that can make the ‘optimal product mix’ a competitive exchange equilibrium. Can…arrow_forward
- Suppose that 2 roommates, Andy and Bob, are trying to pick an apartment in Chicago. Locations can be chosen from set of alternatives A={ x: x exists [0,1]}. Andy and Bob both want to minimize their daily commute but they work at different locations: Andy at xA=0.3, while Bob at xB=0.6. Specifically, their utility functions are: ui(x)= -(x-xi)2. Question: What is the set of all Pareto Efficient outcomes in A, assuming no money can be exchanged.arrow_forwardConsider the utility functions below of two individuals, A and B, and bundles of goods Q and R. UA=X0.5Y0.5; UB=X+2Y; Bundle Q (10, 10); Bundle R (10, 15). Suppose the total X and total Y available in the economy are both equal to 20. a. If initially both individuals are consuming bundle Q, then a pareto-improvement is possible through reallocation of goods, i.e. individual A gives B some of his good X in exchange for some of individual B’s good Y. (True or False? Explain through mathematical examples).b. Pareto-optimality is achieved if we give individual B Bundle R and the remaining goods X and Y available in the economy is given to individual A. (True or false? Explain through a graphical example)arrow_forwardRemember to illustrate diagramatically for some of these parts! 6. Assume you can work as many hours you wish at £12 per hour (net of tax). If you do not work, you have no income. You have no ability to borrow or lend, so your consumption, c, is simply equal to your income. a) Derive and plot the feasible set, between daily values of consumption c, and “leisure”, l. Label the values at the intercepts (the points where the feasible frontier cuts the two axes). b) Assume that your optimal choice of consumption and leisure is to work 8 hours per day. Illustrate this choice diagrammatically using the feasible set and indifference curves. c) Use indifference curves and the feasible set to show why, given the properties of the optimal choice in part b), it is not optimal to work, say, 10, or 6 hours per day. d) Now assume that you receive an income of £140 per week from an unknown benefactor. Show the impact on your feasible set, and show a new optimal choice in which consumption increases…arrow_forward
