Concept explainers
Videos
A.
Statement of
Statement of cash flow is a financial statement that shows the cash and cash equivalents of a company for a particular period of time. It shows the net changes in cash, by reporting the sources and uses of cash as a result of operating, investing, and financing activities of a company.
Free cash flow describes the net cash provided from operating activities after making required adjustments for dividends and capital expenditures. In other words, it is the cash flow arrived after making payment for capital expenditures and dividend payments.
To Identify: The company which appears to be the largest at the end of Year 3.
A.
Answer to Problem 13.3ADM
The company which appears to be the largest using the revenue at the end of Year 3 is Company AT.
Explanation of Solution
Company AT has more revenue of $132,447 which is more than the revenue of Company F of revenue $12,466. Hence, Company AT appears to be the largest using the revenue at the end of Year 3.
B.
To Identify: The company which appears to be growing faster across the three years.
B.
Answer to Problem 13.3ADM
Identify the company which appears to be growing faster across the three years.
| Company | Year 3 | Year 2 | Year 1 |
| AT | 104% (1) | 101% (2) | 100% |
| F | 245% (3) | 155% (4) | 100% |
Table (1)
Explanation of Solution
Working Note:
Calculate the growth rate of Company AT for the two years.
Calculate the growth rate of Company F for the two years.
Hence, the company which appears to be growing faster across the three years is Company F.
C.
To Compute: The cash used to purchase property, plant, and equipment as a percent of the cash flows from operating activities for all three years for each company.
C.
Answer to Problem 13.3ADM
Compute the cash used to purchase property, plant, and equipment as a percent of the cash flows from operating activities for all three years for each company.
| Company | Year 3 | Year 2 | Year 1 |
| AT | 68% (5) | 61% (6) | 50% (7) |
| F | 34% (8) | 32% (9) | 77% (10) |
Table (2)
Explanation of Solution
Working Note:
Calculate the cash used to purchase property, plant, and equipment as a percent of the cash flows from operating activities of Company AT for three years.
For Year 3:
For Year 2:
For Year 1:
Calculate the cash used to purchase property, plant, and equipment as a percent of the cash flows from operating activities of Company F for three years.
For Year 3:
For Year 2:
For Year 1:
Hence, the company which appears to be growing faster across the three years is Company F.
D.
To Identify: The company which appears to require more cash to purchase property, plant, and equipment and to explain its impact on free cash flow.
D.
Answer to Problem 13.3ADM
By using the computation in (C), it is clear that the company which appears to require more cash to purchase property, plant, and equipment is Company AT, and its impact on free cash flow is more negative.
Explanation of Solution
The cash used to purchase property, plant, and equipment as a percent of the cash flows from operating activities of Company AT for Year 1 is 50% which is much less than that of Company F of 77%. But for Year 2, and Year 3, the cash used to purchase property, plant, and equipment as a percent of the cash flows from operating activities of Company AT are 61%, and 68%, which are greater than those of Company F of 32%, and 34%.
Hence, as the cash used to purchase property, plant, and equipment as a percent of the cash flows from operating activities of Company AT from Year 1 to Year 3 is increasing, the company which appears to require more cash to purchase property, plant, and equipment is Company AT, and its net impact on free cash flow is more negative.
E.
To Compute: The ratio of free cash flow to revenue for all three years for each company.
E.
Explanation of Solution
Compute the free cash flow of Company AT.
| Year 3 | Year 2 | Year 1 | |
| Cash flows from operating activities | $ 31,338 | $34,796 | $ 39,176 |
Cash used to purchase property, plant, and equipment |
(21,433) |
(21,228) |
(19,728) |
| Free cash flow | $ 9,905 | $13,568 | $ 19,448 |
Table (3)
Compute the ratio of free cash flow to revenue for Company AT.
| Year 3 | Year 2 | Year 1 | |
| Free cash flow (A) | $ 9,905 | $13,568 | $ 19,448 |
| Revenue (B) | 132,447 | 128,752 | 127,434 |
| Ratio of free cash flow to revenues
|
7.5% | 10.5% | 15.3% |
Table (4)
Compute the free cash flow of Company F.
| Year 3 | Year 2 | Year 1 | |
| Cash flows from operating activities | $ 5,457 | $4,222 | $1,612 |
Cash used to purchase property, plant, and equipment |
(1,831) |
(1,362) |
(1,235) |
| Free cash flow | $ 3,626 | $2,860 | $ 377 |
Table (5)
Compute the ratio of free cash flow to revenue for Company F.
| Year 3 | Year 2 | Year 1 | |
| Free cash flow (A) | $ 3,626 | $2,860 | $ 377 |
| Revenue (B) | 12,466 | 7,872 | 5,089 |
| Ratio of free cash flow to revenues
|
29.1% | 36.3% | 7.4% |
Table (6)
Hence, the ratio of free cash flow to revenue for Year 3, Year 2, and Year 1 for Company AT are 7.5%, 10.5%, and 15.3% respectively. And for Company F, they are 29.1%, 36.3%, and 7.4% respectively.
To plot: The data on a line chart with the years on the horizontal axis.
Explanation of Solution
Plot the data on a line chart with the years on the horizontal axis.
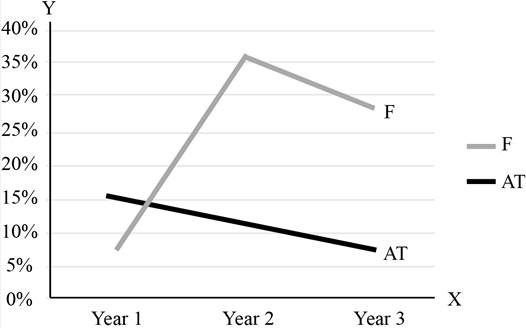
Figure (1)
F.
To Interpret: The chart.
F.
Explanation of Solution
The ratio of free cash flow to revenue of Company AT for Year 1 was better when compared to Company F. But in the Year 2, and Year 3, the ratios of free cash flow to revenue of Company F were much greater than Company AT. The cash flows from operating activities of Company F have significantly increased over the years. Due to this, there is an increase in the ratio of free cash flows to revenues. The decline in the ratio of free cash flows to revenues of Company AT is due to the decline in the cash flows from operating activities, and increase in the cash needed to purchase property, plant, and equipment over the three years. The net result of this is that the ratio is declined.
Want to see more full solutions like this?
Chapter 13 Solutions
Corporate Financial Accounting


- Question 1 Josh and Amy are finance trainees at a company which has been reporting a positive cash flow for the last 5 years. Both Josh and Amy have learned in their finance courses at the university that “cash is king” and is more important than reported profits by a company. Guided by this knowledge, none of them feels a need to review the company’s cash flow pattern over time. Are they necessarily correct in their understanding about a firm’s long-term cash flow situation? Discuss brieflyarrow_forwardAnalyze and compare Amazon.com to Netflix Amazon.com, Inc. (AMZN) is one of the largest Internet retailers in the world. Netflix, Inc. (NFLX) provides digital streaming and DVD rentals in the United States. Amazon and Netflix compete in streaming and digital services; however, Amazon also sells many other products online. The cash, temporary investments, operating expenses, and depreciation expense from recent financial statements were reported as follows for both companies (in millions): a. Determine the days cash on hand for Amazon and Netflix. Round all calculations to one decimal place. b. Interpret the results.arrow_forwardWhich of the following are ‘uses’ of cash from a cash flow perspective? (mark all that apply) a. Borrowing on the firm’s revolving line of credit b. Implementing a new share buyback program c. Purchasing a piece of real estate where you plan to build a new factory d. Purchasing inventoryarrow_forward
- Preparing a Statement of Cash Flows from Balance Sheets and Income Statements. Nojiri Pharmaceutical Industries develops, manufactures, and markets pharmaceutical products in Japan. The Japanese economy experienced recessionary conditions in recent years. In response to these conditions, the Japanese government increased the proportion of medical costs that is the patients responsibility and lowered the prices for prescription drugs. Exhibits 3.28 and 3.29 present the firms balance sheets and income statements for Years 1 through 4. REQUIRED a. Prepare a worksheet for the preparation of a statement of cash flows for Nojiri Pharmaceutical Industries for each of the years ending March 31, Year 2 to Year 4. Follow the format of Exhibit 3.14 in the text. Notes to the financial statements indicate the following: (1) The changes in Accumulated Other Comprehensive Income relate to revaluations of Investments in Securities to market value. The remaining changes in Investments in Securities result from purchases and sales. Assume that the sales occurred at no gain or loss. (2) No sales of property, plant, and equipment took place during the three-year period. (3) The changes in Other Noncurrent Assets are investing activities. (4) The changes in Employee Retirement Benefits relate to provisions made for retirement benefits net of payments made to retired employees, both of which the statement of cash flows classifies as operating activities. (5) The changes in Other Noncurrent Liabilities are financing activities. b. Prepare a comparative statement of cash flows for Year 2, Year 3, and Year 4. c. Discuss the relations among net income and cash flow from operations and the pattern of cash flows from operating, investing, and financing transactions for Year 2, Year 3, and Year 4.arrow_forward1. Identify two warning signals that could have negative implications with respect to the company’s ability to generate cash flows to meet its future needs. In each case, explain why the signal you have identified could reflect a cash flow problem. 2. At the annual general meeting of White Star, the managing director, Ms. Rose Dawson, made the following statement: ‘ Recently a number of articles in the financial press have questioned the financial position of our company. This criticism is totally unjustified. Net profit was $25 million and total assets have increased by $160 million. These results show that 2019 was a very successful year for White Star. ’ Comment on Ms. Dawson’s statement. Info: WR: 2018 = 380m 2019 = 395 m CR: 2018 = 1.8m 2019 = 1.6m QR: 2018 = 1.2m 2019 = 0.9m Debt-to-equity ratio: 2018 = 0.85 times 2019 = 0.68 times Return-on-equity ratio: 2018 = 8.33 % 2019 = 12.26% Earnings per share: 2018 = 0.312m 2019 = 0.475m Net operating profit after tax is $25…arrow_forwardSelect TRUE if the statement is correct and FALSE if incorrect. 1. Miller Orr Model is a tool to determine the exact amount of cash needed by the business and it assumes fixed amount of cash through out the operating cycle. * 2. A company buys marketable securities when the cash outflows exceed the cash inflows. * 3. There is no cost in holding large amounts of cash for business operations. * 4. Cash flows are always certain in whatever type of industry the business belongs to. * 5. Baumol Model incorporates the variability of cash flows depending on the seasonality of need. * 6. The longer the operating cycle of a business, the more a business needs cash for its operations. * 7. Any excess of cash beyond the upper limit will be used for investment in marketable securities. * 8. The lower the amount of cash needed, the lower the transaction cost. * 9. Holding more cash means having a higher opportunity cost associated with cash holdings. * 10. Marketable securities are long term…arrow_forward
- CASH FLOW ANALYSIS a) Yahoo! Engages in purchases and sales of marketable securities. Why do you believe Yahoo! pursue this activity? EXPLAIN BRIELFY.Yahoo! reports $33.21 million of deferred revenue. Based on your understanding of Yahoo!’s operation, what do you believe this amount represents. EXPLAIN BRIEFLY.arrow_forwardMastery Problem: Statement of Cash Flows Championship Boxing, Inc. Championship Boxing, Inc. is a small manufacturer of cardboard boxes of all sizes. You have reported for your first day of work, and the company is in an uproar. Yearly financial statements are being prepared, but a computer malfunction of the company’s new BOX-9000 computer has inadvertently erased parts of the company’s balance sheet, along with almost all related data except the company’s statement of cash flows. The IT department is working to retrieve earlier backups, but estimates that the reconstruction of the data will take about 24 hours. Unfortunately, financial statements are to be presented at a stockholders’ meeting in one hour. The company uses the indirect method to prepare its statement of cash flows (rather than the direct method), so your new supervisor believes the missing data for the balance sheet can be prepared using the statement of cash flows. You are assigned this task, since you were top…arrow_forwardMastery Problem: Statement of Cash Flows Championship Boxing, Inc. Championship Boxing, Inc. is a small manufacturer of cardboard boxes of all sizes. You have reported for your first day of work, and the company is in an uproar. Yearly financial statements are being prepared, but a computer malfunction of the company’s new BOX-9000 computer has inadvertently erased parts of the company’s balance sheet, along with almost all related data except the company’s statement of cash flows. The IT department is working to retrieve earlier backups, but estimates that the reconstruction of the data will take about 24 hours. Unfortunately, financial statements are to be presented at a stockholders’ meeting in one hour. The company uses the indirect method to prepare its statement of cash flows (rather than the direct method), so your new supervisor believes the missing data for the balance sheet can be prepared using the statement of cash flows. You are assigned this task, since you were top…arrow_forward
 Financial And Managerial AccountingAccountingISBN:9781337902663Author:WARREN, Carl S.Publisher:Cengage Learning,
 Managerial AccountingAccountingISBN:9781337912020Author:Carl Warren, Ph.d. Cma William B. TaylerPublisher:South-Western College Pub
 Financial & Managerial AccountingAccountingISBN:9781337119207Author:Carl Warren, James M. Reeve, Jonathan DuchacPublisher:Cengage Learning
 Corporate Financial AccountingAccountingISBN:9781305653535Author:Carl Warren, James M. Reeve, Jonathan DuchacPublisher:Cengage Learning
 Financial Reporting, Financial Statement Analysis...FinanceISBN:9781285190907Author:James M. Wahlen, Stephen P. Baginski, Mark BradshawPublisher:Cengage Learning