
Concept explainers
Videos
Reminder Round all answers to two decimal places unless otherwise indicated.
River Flow The graph in Figure
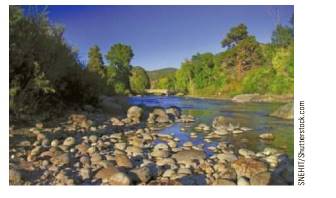
a. Use functional notation to express the flow at the end of July, and then estimate that value.
b. When is the flow at its greatest?
c. At what time is the flow increasing the fastest?
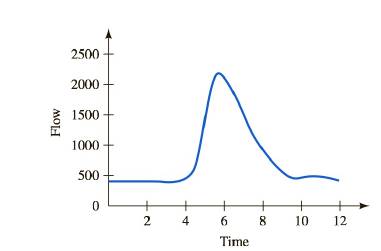
FIGURE
d. Estimate the average rate of change per month in the flow during the first 2 months of the year.
e. In light of the source of the Arkansas River, interpret your answers to parts b, c, and d.
Want to see the full answer?
Check out a sample textbook solution
Chapter 1 Solutions
Functions and Change: A Modeling Approach to College Algebra (MindTap Course List)
Additional Math Textbook Solutions
Algebra 1
College Algebra (5th Edition)
Algebra 1, Homework Practice Workbook (MERRILL ALGEBRA 1)
College Algebra
Beginning and Intermediate Algebra
Algebra: Structure And Method, Book 1


- ReminderRound all answers to two decimal places unless otherwise indicated. Minimum WageOn July 24, 2008, the federal minimum wage was 6.55perhour. On July 24, 2009, this wage was raised to 7.25perhour. If W(t) denotes the minimum wage, in dollars per hour, as function of time, in years, use the given information to estimate dWdt in 2009.arrow_forwardReminderRound all answers to two decimal places unless otherwise indicated. An InvestmentIn 2010, an investor put money into a fund. The graph in Figure 1.26 shows the value, v=v(d) of the investment, in dollars, as a function of date d. a.Express the original investment using functional notation and give its value. b.Is the graph concave up or concave down? Explain what this means about the growth in value of the account. c.When will the value of the investment reach 55,000? FIGURE 1.26 An investment d.What is the average yearly increase from 2050 to 2060? e.Which is larger, the average yearly increase from 2050 to 2060 or the average yearly increase from 2010 to 2020? Explain your reasoning.arrow_forwardReminderRound all answers to two decimal places unless otherwise indicated. Cutting TreesIn forestry management, it is important to know the net stumpage value of a stand that is, a group of trees. This is the commercial value of the trees minus the costs of felling, hauling, etc. The graph in Figure 1.39 shows the net stumpage value V, in dollars per acre, of a Douglas fir stand in the Pacific Northwest as a function of the age t, in years, of the stand. FIGURE 1.39 Net stumpage value of a Douglas Fir a. Estimate the net stumpage value of a Douglas fir 1 stand that is 60 years old. b. Estimate the age of a Douglas fir stand whose net stumpage value is 40,000peracre. c. At what age does the commercial value of the stand equal the costs of felling, hauling, etc.? d. At what age is the net stumpage value increasing the fastest? e. This graph shows V only up to age t=160years, but the Douglas fir lives for hundreds of years. Draw a graph to represent what you expect for V over the life span of the tree. Explain your reasoning.arrow_forward
- Reminder Round all answers to two decimal places unless otherwise indicated. Auto Loan Rates The graph in Figure 1.28 shows rates r for new car loans as a function of the date d. Explain in general terms the behavior of r(d) from 1980 to 2010.arrow_forwardReminder Round all answers to two decimal places unless otherwise indicated. Tax Owed The following table shows the income tax T owed in a certain state as a function of the taxable income I, both measured in dollars. I=Taxableincome T=Taxowed 16,000 870 16,200 888 16,400 906 16,600 924 a. Make a table showing, for each of the intervals in the tax table above, the average rate of change in T. b. Describe the general trend in the average rate of change. What does this mean in practical terms? c. Would you expect T to have a limiting value? Be sure to explain your reasoning.arrow_forwardReminderRound all answers to two decimal places unless otherwise indicated. Household DebtThe graph in Figure 1.27 shows the average American household debt h as a function of the date d. Here h(d) represents house hold debt as a percentage of disposable income. a.Explain the meaning of h(1975) in practical terms, and use the graph to find its value. b.The graph reaches a maximum value. Estimate the maximum value and the year in which it occurred. FIGURE 1.27arrow_forward
- Reminder Round all answers to two decimal places unless otherwise indicated. Yellowfin Tuna Data were collected comparing the weight W, in pounds, of a yellowfin tuna to its length L, in centimeters. These data are presented in the following table. L=Length W=Weight 70 14.3 80 21.5 90 30.8 100 42.5 110 56.8 120 74.1 130 94.7 140 119 160 179 180 256 a. What is the average rate of change, in weight per centimeter of length, in going from a length of 100 centimeters to a length of 110 centimeters? b. What is the average rate of change, in weight per centimeter of length, in going from 160 to 180 centimeters? c. Judging from the data in the table, does an extra centimeter of length make more difference in weight for a small tuna or for a large tuna? d. Use the average rate of change to estimate the weight of a yellowtuna fish that is 167 centimeters long? e. What is the average rate of change, in length per pound of weight, in going from a weight of 179 pounds to a weight of 256 pounds? f. What would you expect to be the length of a yellow tuna weighing 225 pounds?arrow_forwardReminder Round all answers to two decimal places unless otherwise indicated. Sales Income The following table shows the net monthly income N for a real estate agency as a function of the monthly real estate sales s, both measured in dollars. s=Sales N=Netincome 450,000 4000 500,000 5500 550,000 7000 600,000 8500 a. Make a table showing, for each of the intervals in the tax table above, the average rate of change in N. What pattern do you see? b. Use the average rate of change to estimate the net monthly income for monthly real estate sales of 520,000. In light of your answer to part a, how confident are you that your estimate is an accurate representation of the actual income? c. Would you expect N to have a limiting value? Be sure to explain your reasoning.arrow_forwardReminder Round all answers to two decimal places unless otherwise indicated. t is measured in thousands of years, and C=C(t) is the amount, in grams, of carbon-14 remaining. Carbon-14 unstable radioactive t=Thousandofyears C=Gramsremaining 0 5 5 2.73 10 1.49 15 0.81 20 0.44 a. What is the average yearly rate of change of carbon-14 during the first 5000 years? b. How many grams of carbon-14 would you expect to find remaining after 1236 years? c. What would you expect to be the limiting value of C?arrow_forward
- Reminder Round all answers to two decimal places unless otherwise indicated. Note Some of the formulas below use the special number e, which was presented in the Prologue. The height of the winning pole vault in the early years of the modern Olympic Games can be modeled as a function of time by the formula H=0.05t+3.3 Here t is the number of years since 1900, and H is the winning height in meters. One meter is 39.37 inches. a. Calculate H(4) and explain in practical terms what your answer means. b. By how much did the height of the winning pole vault increase from 1900 to 1904? From 1904 to 1908?arrow_forwardReminderRound all answers to two decimal places unless otherwise indicated. Tornadoes In OklahomaThe graph in Figure 1.41 shows the number T=T(d) of tornadoes in Oklahoma Fl/EF1 and stronger reported by the National Climatic Data Center. Round your answers to the nearest whole number. a. When were the most tornadoes reported? How many were reported in that year? b. When were the fewest tornadoes reported? How many were reported in that year? c. What was the average yearly rate of decrease in tornadic activity from 2011 to 2012? d. What was the average yearly rate of increase in tornadic activity from 2009 to 2011? e. What was the average yearly rate of change that is, the average yearly rate of total increase or total decrease in tornadic activity from 2009 to 2012? FIGURE 1.41 Tornadoes in Oklahomaarrow_forwardReminder Round all answers to decimal places unless otherwise indicated. Health Plan The managers of an employee health plan for a firm have studied the balance B, in millions of dollars, in the plan account as a function of t, the number of years since the plan was instituted. They have determined that the rate of change dBdt in the account balance is given by the formula dBdt=10e0.1t12. a. Use your calculator to make a graph of dBdt versus t over the first 5 years of the plan. b. During what period is the account balance B decreasing? c. At what time is the account balance B at its minimum?arrow_forward
 Functions and Change: A Modeling Approach to Coll...AlgebraISBN:9781337111348Author:Bruce Crauder, Benny Evans, Alan NoellPublisher:Cengage Learning