
Concept explainers
Videos
Reminder Round all answers to two decimal places unless otherwise indicated.
Cutting Trees In forestry management, it is important to know the net stumpage value of a stand (that is, a group) of trees. This is the commercial value of the trees minus the costs of felling, hauling, etc. The graph in Figure

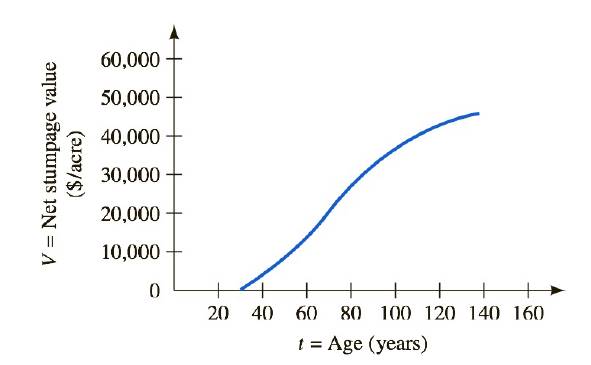
FIGURE
a. Estimate the net stumpage value of a Douglas fir 1 stand that is
b. Estimate the age of a Douglas fir stand whose net stumpage value is
c. At what age does the commercial value of the stand equal the costs of felling, hauling, etc.?
d. At what age is the net stumpage value increasing the fastest?
e. This graph shows V only up to age

Trending nowThis is a popular solution!

Chapter 1 Solutions
Functions and Change: A Modeling Approach to College Algebra (MindTap Course List)
Additional Math Textbook Solutions
Intermediate Algebra (13th Edition)
Beginning and Intermediate Algebra
Pre-Algebra Student Edition
College Algebra (6th Edition)
College Algebra (10th Edition)
College Algebra


- Reminder Round all answers to two decimal places unless otherwise indicated. Auto Loan Rates The graph in Figure 1.28 shows rates r for new car loans as a function of the date d. Explain in general terms the behavior of r(d) from 1980 to 2010.arrow_forwardReminderRound all answers to two decimal places unless otherwise indicated. River FlowThe graph in Figure 1.37 shows the mean flow F for the Arkansas River, in cubic feet of water per second, as a function of the time t, in months, since the start of the year. The flow is measured near the rivers headwaters in the Rocky Mountains. a.Use functional notation to express the flow at the end of July, and then estimate that value. b.When is the flow at its greatest? c.At what time is the flow increasing the fastest? FIGURE 1.37 Flow for the Arkansas River d.Estimate the average rate of change per month in the flow during the first 2 months of the year. e.In light of the source of the Arkansas River, interpret your answers to parts b, c, and d.arrow_forwardReminderRound all answers to two decimal places unless otherwise indicated. Minimum WageOn July 24, 2008, the federal minimum wage was 6.55perhour. On July 24, 2009, this wage was raised to 7.25perhour. If W(t) denotes the minimum wage, in dollars per hour, as function of time, in years, use the given information to estimate dWdt in 2009.arrow_forward
- Reminder: Round all answer to two decimal places unless otherwise indicated. a. How much does it cost to prepare and mail a 3-page letter if your secretary spends 2 hours on typing and corrections? b. Use a formula to express the cost of preparing and mailing a letter as a function of the number of pages in the letter and the time it takes your secretary to type it. Identify the function and each of the variables you use, and state the units. c. Use the function you made in part b to find the cost of preparing and mailing a 2-page letter that it takes your secretary 25 minutes to type. Note: 25 minutes is 25/60 hour.arrow_forwardReminderRound all answers to two decimal places unless otherwise indicated. Household DebtThe graph in Figure 1.27 shows the average American household debt h as a function of the date d. Here h(d) represents house hold debt as a percentage of disposable income. a.Explain the meaning of h(1975) in practical terms, and use the graph to find its value. b.The graph reaches a maximum value. Estimate the maximum value and the year in which it occurred. FIGURE 1.27arrow_forwardReminderRound all answers to two decimal places unless otherwise indicated. InflationDuring a period of high inflation, a political leader was up for re-election. Inflation had been increasing during his administration, but he announced that the rate of increase of inflation was decreasing. Draw a graph of inflation versus time that illustrates this situation. Would this announcement convince you that economic conditions were improving?arrow_forward
- ReminderRound all answers to two decimal places unless otherwise indicated. An InvestmentIn 2010, an investor put money into a fund. The graph in Figure 1.26 shows the value, v=v(d) of the investment, in dollars, as a function of date d. a.Express the original investment using functional notation and give its value. b.Is the graph concave up or concave down? Explain what this means about the growth in value of the account. c.When will the value of the investment reach 55,000? FIGURE 1.26 An investment d.What is the average yearly increase from 2050 to 2060? e.Which is larger, the average yearly increase from 2050 to 2060 or the average yearly increase from 2010 to 2020? Explain your reasoning.arrow_forwardReminder Round all answers to decimal places unless otherwise indicated. Health Plan The managers of an employee health plan for a firm have studied the balance B, in millions of dollars, in the plan account as a function of t, the number of years since the plan was instituted. They have determined that the rate of change dBdt in the account balance is given by the formula dBdt=10e0.1t12. a. Use your calculator to make a graph of dBdt versus t over the first 5 years of the plan. b. During what period is the account balance B decreasing? c. At what time is the account balance B at its minimum?arrow_forwardReminder: Round all answer to two decimal places unless otherwise indicated. 15.Total Cost The total cost C for a manufacturer during a given time period is a function of the number N of items produced during that period. To deter mine a formula for the total cost, we need to know the manufacturers fixed costs covering things such as plant maintenance and insurance, as well as the cost for each unit produced, which is called the variable cost. To find the total cost, we multiply the variable cost by the number of items produced during that period and then add the fixed costs. Suppose that a manufacturer of widgets has fixed costs of 9000 per month and that the variable cost is 15 per widget so it costs 15 to produce 1 widget. a. Use a formula to express the total cost C of this manufacturer in a month as a function of the number of widgets produced in a month. Be sure to state the units you use. b. Express using functional notation the total cost if there are 250 widgets produced in a month, and then calculate that value.arrow_forward
- Reminder Round all answers to two decimal places unless otherwise indicated. Giants Ants and Spiders Many science fiction movies feature animals such as ants, spiders, or apes growing to monstrous sizes and threatening defenseless Earthlings. Of course, they are in the end defeated by the hero and heroine. biologists use power function as a rough guide to relate body weight and cross-sectional area of limbs to length or height. Generally, weight is thought to be proportional to the cube of length, whereas the cross-sectional area of limbs is proportional to the square of length. Suppose an ant, having been exposed radiation is enlarged to 500 times its normal length. Such an event can occur only in Hollywood fantasy. Radiation is utterly incapable of causing such a reaction. a.By how much will its weight be increased? b.By how much will the cross-sectional area of its legs be increased? c.Pressure on a limb is weight divided by cross-sectional area. By how much has the pressure on a leg of the giant ant increased? What do you think is likely to happen to this unfortunate ant? Note: The factor by which pressure increases is given by . FactorofincreaseinweightFactorofincreaseinarea)arrow_forwardReminder Round all answers to two decimal places unless otherwise indicated. Choosing a Bat A chart from Dicks sporting Goods gives the recommended bat length B in inches for a man weighing between 161 and 170 pounds as a function of his height h in inches. The table is partially reproduced on the next page. h=Height B=Batlength 4548 30 4952 31 5356 31 5760 32 6164 32 6568 33 6972 33 73+ 33 a. Explain in practical terms the meaning of B(55) and give its value. b. Use functional notation to express the recommended bat length for a man weighing between 161 and 170 pounds if his height is 63inches.arrow_forwardReminderRound all answers to two decimal places unless otherwise indicated. Tornadoes In OklahomaThe graph in Figure 1.41 shows the number T=T(d) of tornadoes in Oklahoma Fl/EF1 and stronger reported by the National Climatic Data Center. Round your answers to the nearest whole number. a. When were the most tornadoes reported? How many were reported in that year? b. When were the fewest tornadoes reported? How many were reported in that year? c. What was the average yearly rate of decrease in tornadic activity from 2011 to 2012? d. What was the average yearly rate of increase in tornadic activity from 2009 to 2011? e. What was the average yearly rate of change that is, the average yearly rate of total increase or total decrease in tornadic activity from 2009 to 2012? FIGURE 1.41 Tornadoes in Oklahomaarrow_forward
 Functions and Change: A Modeling Approach to Coll...AlgebraISBN:9781337111348Author:Bruce Crauder, Benny Evans, Alan NoellPublisher:Cengage Learning